Strengthen your programming skills with tips and techniques from the experts
Deviance residuals and the DEVIANCE function in SAS

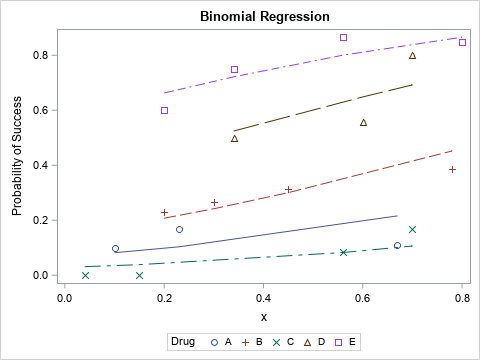
Many people have an intuitive feel for residuals in least square models and know that the sum of squared residuals is a goodness-of-fit measure. Generalized linear regression models use a different but related idea, called deviance residuals. What are deviance residuals, and how can you compute them? Deviance residuals (and