I've read several articles that mentioned the north magnetic pole has been moving more in the past few decades, than in the previous few hundred years. And as a Map Guy, I knew I just had to plot this data on a map, and see it for myself! I provide a lot of details below - but if you're not interested in the details, feel free to jump to the final map at the end!
Magnetic North, Maps, and Compasses
Before we start on the map, here's a bit of trivia related to magnetic north. When map-makers draw a map that that will be used for something important (such as navigation), they must indicate the magnetic declination on the map, and that map is only good for a short time (because the magnetic north pole moves). Therefore, to use a map for accurate navigation, it must be a recent map, and the map must indicate the magnetic declination. And then you must account for that magnetic declination in your compass readings (some compasses let you set the magnetic declination, so you don't have to add offsets manually).
My friend Gene-Paul is a forest firefighter, and he sent me this picture of some of the compasses they use. Who knew there were this many kinds of compasses!?! (Thanks Gene-Paul!)

Existing Maps
When you're thinking about creating your own map, it's always best to first check what's already out there. You might find some good things you want to include in your map, and some bad things you might want to avoid in your map. Here's a map of the shifting magnetic north pole, from a NOAA page:
I like that they have used a map that shows the terrain (both above, and below water), but I don't like that the text labels are too small for me to read (text labels for the colored markers, and the longitude lines). Also, if I didn't already know what area the magnetic north pole was in, I would not know that the land area shown in this map was Canada. This gave me a few things to keep in mind when creating my map.
The Data
To create my own map, I first needed the data. I did a few web searches, and soon found a good data source. The National Oceanic and Atmospheric Administration (NOAA) has a web page about the Wandering of the Geomagnetic poles (that's where I got the map above), and at the bottom of that page they have a link to the annual International Geomagnetic Reference Field (IGRF) model data. Here's what the text data looks like - the columns are longitude, latitude, and year.

I downloaded/saved their data file (NP.xy.txt) from the browser window, and imported it into SAS with the following code:
filename dataurl "NP.xy.txt";
data magnetic_pole_locations;
infile dataurl firstobs=1 pad;
format Long Lat comma8.3;
label Lat='Latitude (degrees)';
label Long='Longitude (degrees east)';
input Long Lat Year;
run;
My Preliminary SAS Maps
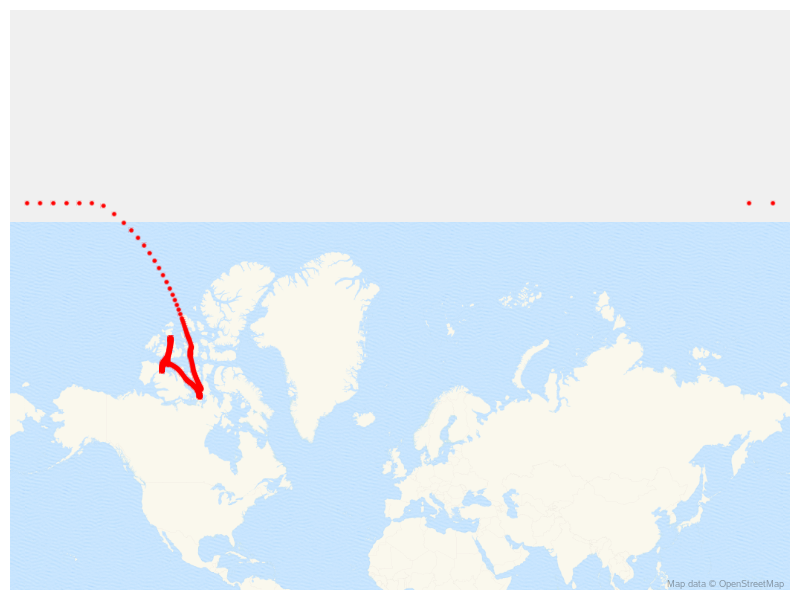
One of the great things about the new Proc SGmap is that it makes plotting lat/long data as markers on a tile map really easy, with a minimum of code. But when I plot this particular data on an OpenStreetmap tile map, it just doesn't produce a very useful map. The default OpenStreetmaps are not really meant for plotting data that's this close to the north pole.
proc sgmap plotdata=magnetic_pole_locations noautolegend;
openstreetmap;
scatter x=long y=lat / markerattrs=(color=red symbol=circlefilled size=5px);
run;
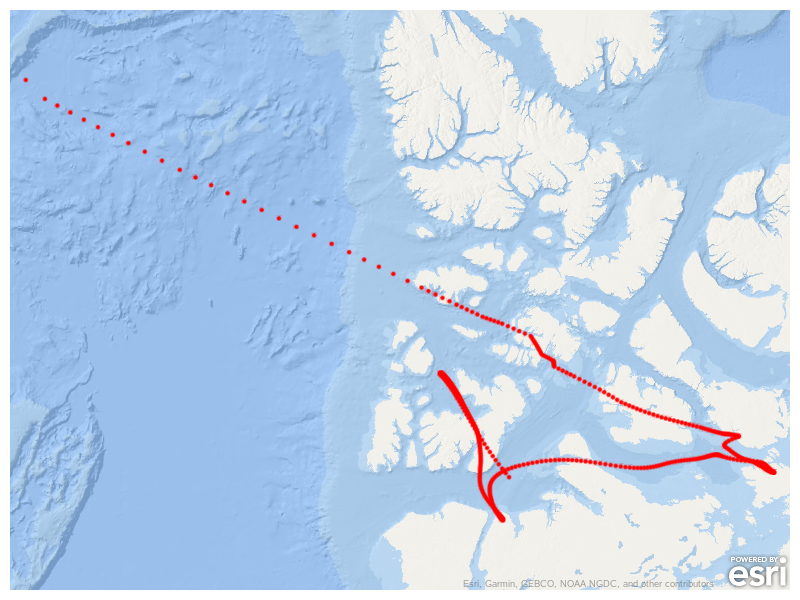
Therefore, instead of using an OpenStreetmap (above), let's use a special Esri polar map that's specifically designed for plotting data near the north pole. With this change (below), it's looking a lot more like the NOAA map from the original article, and is starting to become useful.
proc sgmap plotdata=magnetic_pole_locations noautolegend;
esrimap url='http://services.arcgisonline.com/arcgis/rest/services/Polar/Arctic_Ocean_Base/MapServer';
scatter x=long y=lat / markerattrs=(color=red symbol=circlefilled size=5px);
run;
Next I want to add some lines (or circles) of latitude. This will help see how close to the true north pole the points are, and will provide good reference lines to help get your brain oriented to the map. I use a data step to loop through some values along the rings, and save them in a dataset. Notice that rather than using variables named lat and long, I use lat_ring and long_ring. By using different variable names, this allows me to combine this dataset with my magnetic_pole_locations dataset (you can only specify one plotdata= dataset in SGmap), and still plot the rings and markers separately.
data rings;
do lat_ring = 70 to 90 by 5;
do long_ring = -180 to 180 by 5;
output;
end;
end;
run;
data my_data; set magnetic_pole_locations rings;
run;
proc sgmap plotdata=my_data noautolegend;
esrimap url='http://services.arcgisonline.com/arcgis/rest/services/Polar/Arctic_Ocean_Base/MapServer';
series x=long_ring y=lat_ring / group=lat_ring lineattrs=(color=gray55) tip=none;
scatter x=long y=lat / markerattrs=(color=red symbol=circlefilled size=5px);
run;
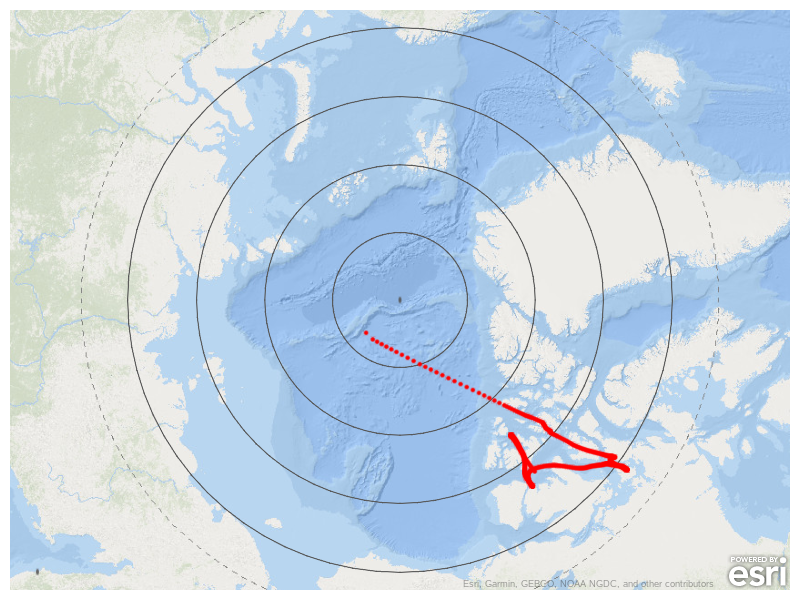
Notice that since Proc SGmap automatically zooms in/out to select a map area that 'fits' the data, plotting these rings zooms that map out a bit, and centers it on the north pole. When studying the location of magnetic north, I think it's good to show the map centered on the north pole like this.
I like having the rings of latitude ... but someone looking at the map might not know exactly which rings these are. Therefore I add a text label at longitude 120 along each ring. Notice that I define an escape character, so I can add the '00ba'x character (degrees symbol) to the end of the latitude number.
ods escapechar='^';
data rings; set rings;
length label_ring $25;
if long_ring=120 then label_ring=trim(left(lat_ring))||"^{unicode '00ba'x}";
run;
proc sgmap plotdata=my_data noautolegend;
esrimap url='http://services.arcgisonline.com/arcgis/rest/services/Polar/Arctic_Ocean_Base/MapServer';
series x=long_ring y=lat_ring / group=lat_ring lineattrs=(color=gray55) tip=none;
text x=long_ring y=lat_ring text=label_ring / textattrs=(color=gray55 size=12pt) position=left tip=none;
scatter x=long y=lat / markerattrs=(color=red symbol=circlefilled size=5px);
run;
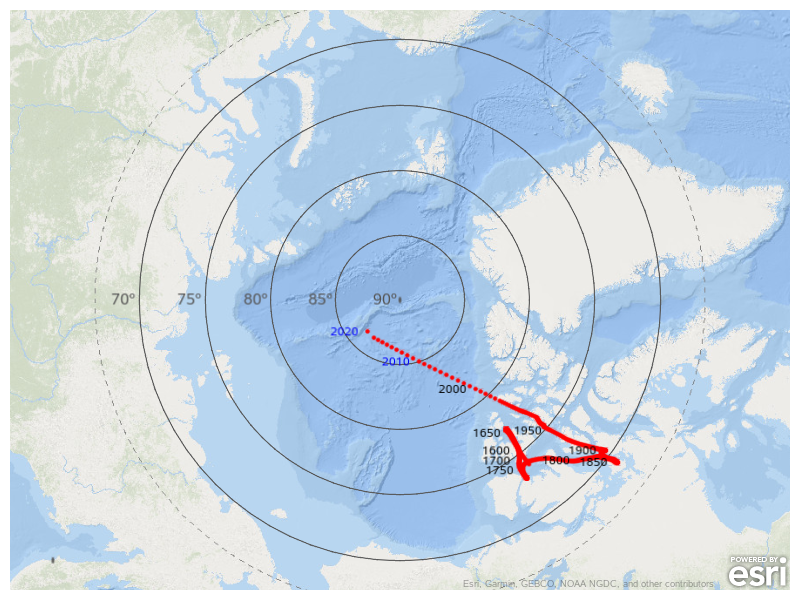
Now that we've got text labels on the latitude rings, let's also add some text labels to the red markers. The easiest and most direct way to add labels would probably be using the datalabel= option on the scatter statement. But I wanted to exercise a lot of control over the labels, and (in my opinion) the easiest and most direct way to do that is by adding another text statement (or statements, in this case). For the first few hundred years, where the data points are very close together (because the magnetic pole didn't move much), I want to label every 50 years with black text. And for the more recent years, I want to label every 10 years with blue text.
data magnetic_pole_locations; set magnetic_pole_locations
length year_label recent_label $6;
if mod(year,50)=0 then year_label=trim(left(year))||'a0a0'x;
if mod(year,10)=0 and year>2000 then recent_label=trim(left(year))||'a0a0'x;
run;
proc sgmap plotdata=my_data noautolegend;
esrimap url='http://services.arcgisonline.com/arcgis/rest/services/Polar/Arctic_Ocean_Base/MapServer';
series x=long_ring y=lat_ring / group=lat_ring lineattrs=(color=gray55) tip=none;
text x=long_ring y=lat_ring text=label_ring / textattrs=(color=gray55 size=12pt) position=left tip=none;
scatter x=long y=lat / markerattrs=(color=red symbol=circlefilled size=5px);
text x=long y=lat text=year_label / textattrs=(color=black size=9pt) position=left;
text x=long y=lat text=recent_label / textattrs=(color=blue size=9pt) position=left;
run;
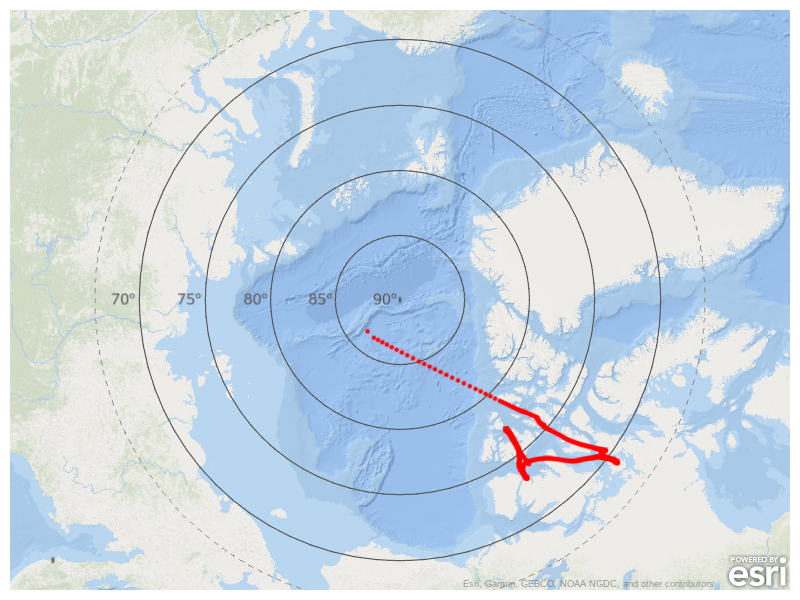
My Final SAS Map
If you're map-savvy, you might recognize Greenland in the map above, and from Greenland you could intuit where Canada is, etc. But it sure would be easier if we had some labels for the land areas. Rather than relying on an automated technique to calculate the lat/long location for the labels (such as using the %centroid macro), I decided to hard-code the values. This way I can place the labels exactly where I want them.
data country_names;
input lat_country long_country label_country $ 24-80;
label_country=trim(left(label_country));
datalines;
68.301721 -153.8469162 Alaska
67.0276347 161.2927574 Russia
66.273992 -104.4765288 Canada
76.2910011 -45.3329711 Greenland
64.7710718 -17.7811442 Iceland
68.7642254 23.4749876 Norway
65.4826228 19.2217949 Sweden
65.436497 29.9555922 Finland
65.985969 60.3296276 Russia
;
run;
data my_data; set magnetic_pole_locations rings country_names;
run;
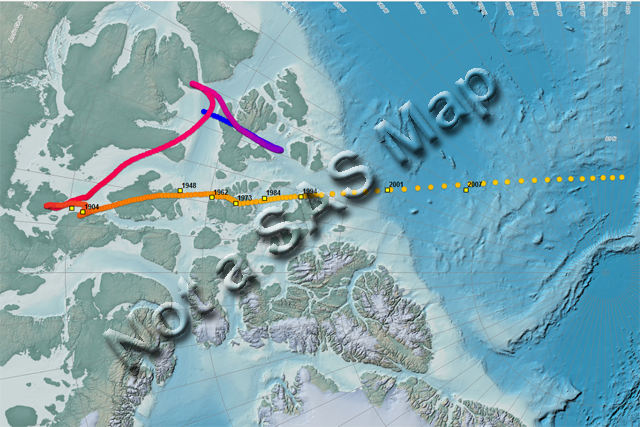
title1 c=gray33 h=18pt "Shift in magnetic north pole (yearly position, &minyear-&maxyear)";
footnote c=gray h=12pt "Data source: https://www.ngdc.noaa.gov/geomag/GeomagneticPoles.shtml";
proc sgmap plotdata=my_data noautolegend;
esrimap url='http://services.arcgisonline.com/arcgis/rest/services/Polar/Arctic_Ocean_Base/MapServer';
text x=long_country y=lat_country text=label_country / textattrs=(color=gray55 size=14pt)
position=center tip=none;
series x=long_ring y=lat_ring / group=lat_ring lineattrs=(color=gray55) tip=none;
text x=long_ring y=lat_ring text=label_ring / textattrs=(color=gray55 size=12pt)
position=left tip=none;
scatter x=long y=lat / markerattrs=(color=red symbol=circlefilled size=5px);
text x=long y=lat text=year_label / textattrs=(color=black size=9pt) position=left;
text x=long y=lat text=recent_label / textattrs=(color=blue size=9pt) position=left;
run;

Extra Credit
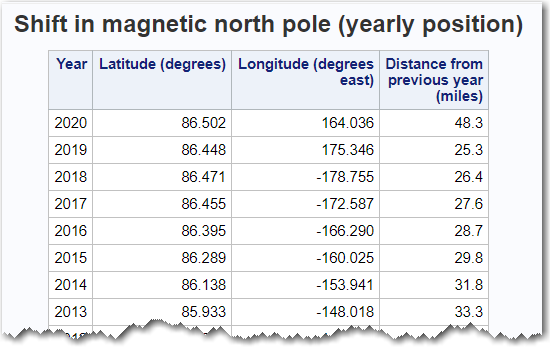
One big question about this data is "how far is the magnetic pole moving each year?" I used the SAS geodist() function to calculate the distance (in miles) between each year's lat/long location, and the previous year's lat/long location.
data magnetic_pole_locations; set magnetic_pole_locations;
/* Convert long from 0 to 360 values to -180 to 180 values, to use with geodist() */
if long>180 then long=long-360;
label yearly_distance='Distance from previous year (miles)';
format yearly_distance comma8.1;
yearly_distance=geodist(lat, long, lag(lat), lag(long), 'DM');
run;
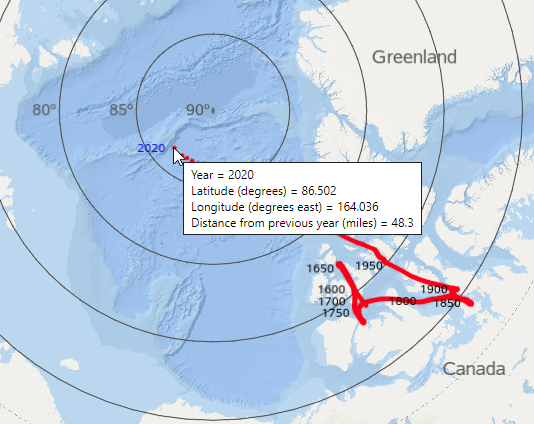
But how do I show this distance to the user? There's definitely not enough room to place labels on the map for each dot. Therefore I used the tip= option to add custom mouse-over text for each red marker. Note that this is a very new SGmap feature, and you'll need the latest release (Viya 3.5) to use it.
scatter x=long y=lat / markerattrs=(color=red symbol=circlefilled size=5px)
tip=(year lat long yearly_distance);
Here's a screen-capture of what the mouse-over text looks like:
It would be quite cumbersome to mouse-over each of the red markers to see all the distances, or to find the marker for a particular year. Therefore I also created a text table of values under the map (using Proc Print). Here's a portion of the table:
Discussion
Did you like this map? Do you have any of your own projects where you could re-use some of the tricks I've shown here? What other analyses might you use on this type of data? What are some of the factors causing the magnetic north pole to shift? What's your forecast - will the magnetic poles shift more, or less, in the next 100 years? (Feel free to discuss in the comments section.)
Here's a link to the interactive version of the map, if you'd like to see the mouse-over text and full table. And here's a link to the SAS code, if you'd like to see all the details.


34 Comments
Will surveyors be more accurate when magnetic is close to true north? What affect will the position of magnetic N have on mapping?
Surveyors used magnetic north for new surveys through the 19th century. The only time magnetic north has been used in many years is retracing an old survey based on magnetic north, The magnetic declination from the time of the old survey is used to convert to new bearings. Astronomic or true north is the new bearing reference. Current surveyors have true north at their fingertips with modern GPS-enabled equipment.
For a period in the 20th century, after magnetic bearings were abandoned and prior to GPS, surveyors would use one of two methods to obtain a true north reference line. If within 2000 feet of a reference monument, they traversed to it and tied the survey to the NC State Plane Coordinate System. They were traversing using an old school transit and steel measuring tape, hence the 2000 foot limitation. If too far to traverse, they would shoot Polaris, the North Star, at dusk to obtain true north at the survey site.
Surveyors have dealt with magnetic north movement for a long time.
Thanks for providing these details, Ed!
Magnetic Declination is also critical for navigating over any distance with a map and compass! GPS batteries die, Screens break... a little training and preparation, that map and compass can save your life and is much LESS likely to fail you. Analogue BABY! CANT BEAT IT!
Good point!
In the late 1970's I started training as a navigating officer in the Royal Navy, we used magnetic compasses, sextants made from brass and plastic slide rules. To help with the calculation of position lines on nautical maps there were the Nautical Almanac Norrie's Tablets, and The Admiralty List of Lights (for buoys and Trinity House lighthouses). When using stars during ocean passages, it would take me 15 to 20 minutes to calculate one position line, so to get 3 lines took an hour and then you started again. Not a problem during ocean passage.
The great thing about this equipment was you could dunk it in a bucket of water and it would still work, even Chinagraph pencils (a type of clay) on sheets of plastic.
For precise coastal navigation there was Decca (a radio interference pattern plotted on charts) and an embryonic satellite navigation system (QX 1), which required manual programming of the 'computer' that took all morning to finish.
GPS is so convenient and easy today but what happens when the satellites are taken out, radio transmitters are jammed or the equipment fails? Can today's navigators still do it the old w
May I use yor final graph, the direction of movement is so direct and the book once I read says it is because of a magnetic effect of a planet closing to the our system and I will follow the this shitfing year by year as a scientific data to ensure it.
Sure! 🙂
Do the same data for the south pole. is it moving at the same ratio as north pole? my old boy scout compass is tracing north pole only.
Gentlemen, Over the past ten or so years I have been watching the movement of magnetic north and I have been thing, could the movements of the magnetic north have a direct like to whale and dolphin stranding's. One article I read on the net suggested that the stranding's were due to Aurora Burials causing magnetic variants in the north of the north sea, on a map it showed where a large stranding of whales occurred on the west coast of Norway in 2016. Perhaps a combination of the two could be the cause for these stranding, as we know the school of thought is that most marine animals use the Earths magnetic field for navigating around the world. Could you let me know what your thoughts are on this. Many thanks Greg.
It's not my area of expertise ... but many of the animals in the oceans seem to have a keen sense of navigation (and/or perhaps memory?) I wouldn't be surprised if they are sensing magnetic (or some form of energy) lines/fields/etc.
Is this an explanation for climate change?
Do you have a chart also detailing the magnetic field strength of the current year 2020 and past year? I have been looking for current year. NOAA did not release it in February as they usually do.
I am curious if these polar magnetic shifts create different weather patterns across the earth?
Hmm ... good question!
Mr. Allison I appreciate you putting all the data together in an easy to understand map.
Thanks!
I’ve read two articles from the same source one dated February 2015 stating it was causing change in the climates, and one from this February stating humans are causing the shift to happen. I’m definitely not a scientist, but I did work on cattle ranch’s on and off most of my life, and know bull poop when I see it. I believe the first was correct, and the second one was because fear sells. It also raises more money. It’s weird how most of the scientists pushing the ideas we can spend our way out of this only have political science degrees.
Yes.
Wow! How cool! We just had a scout lesson ( yes, scouts still exist!) on compasses and I thought the kid giving the instructions was wrong because when I was a kid growing up we always talked about magnetic north being over hudson's bay, which it was at the time! but now I see it has moved significantly! What a concise way to chart the data! Excellent job! I know you posted this article over a year ago, but the concepts and historical data are still valid. Thank you! bc
Glad to see my graphs/maps getting used in a "real world" scenario! 🙂
Such an interesting topic! Thank you for posting the data source 🙂
It takes a special kind of person to think this data is interesting - I'm glad you're that kind of person! 🙂
Great Graphs Thank you. Interesting how much the magnetic north is moving now. I was reading a article on month to month movement, that I can't find now. One that said may of 2021was 4.7 miles, June was 5.2 miles. Tried noaa , nothing yet July??? Very interesting with everything else that's going on.
Thanks for the interesting update! (I'll have to try to find the latest data, and update my map!)
Please do. And I love your map, its brilliant.
Good map, thank you for your time.
Now, to show how much the magnetic declination (correction factor) has changed the past 40 years - for different areas! - you will need to show a person standing near the east coast of North America, perhaps on the Appalachian Trail. Result? Near zero change! The north magnetic pole is moving quickly away from her, BUT!, it is moving in a near-straight line directly away form her position. Further, her position was nearly due south of the original north magnetic pole, and (today, in 2021) it is still near due north of her position.
Not so anywhere else on earth but Mongolia and north Siberia.
A person on land or a boat near north Norway will be lost with an old map and its magnetic variation correction: The "old north magnetic pole" will be shown nearly 60 degrees south . of where the corrected compass will be. On Alaska's north shore, the "Old Magnetic North Pole" will be 50 degrees south of where the compass now points.
Interesting details!
My question is about a Gedanken experiment about why we have more heat in the North Pole Area and less heat in the South Pole Area. See: https://www.discovermagazine.com/environment/freakishly-warm-air-has-again-surged-over-the-north-pole-and-sea-ice-is-breaking-up-north-of-greenland-in-winter - Discover Magazine. The temperature difference - presently - tells me there is something very wrong with the PC concept that we need to kill all the cows because methane is a powerful cause of greenhouse. The difference in temperature says the global heating problem is not caused by greenhouse. My approach is that the cause needs to be geographic since greenhouse would effect both poles the same - period. But then we need to discover what kind of "pre-volcano" or set of "pre-volcanos" could cause the temperatures and the difference in North-South temperature that is happening? And Where are those "pre-volcanos" now? It appears that, that volcanic eruption could be a hummer. And likely to be in Northern Canada or Russia [or the little ocean in between. And does the fast paced change in the Magnetic Pole relate to this [is it a cause of the heating and possible eruption - or is it an effect of the heating and possible eruption]?
anyone can see if north moves away things warm up, if north encroaches its colder and more glaciers are formed. thus all glaciers are not melting at once ,because new gracers are being formed.
Thank you Sir for this great study .
Please. what is your opinion about that the only thing that makes a magnet north 🧲 shift towards any direction is another magnet somewhere around it with probably higher magnet force that is causing the shifting for the earth’s magnetic north !
Likely to be another planet or star or asteroid what ever it called effecting and causing movements inside the magnetic deep core of the earth ?
Sorry - I just graph the data! You'll have to ask someone like a geologist or astro-physicist those questions. 🙂
How do you calculate the movement in miles for the North pole's movement?
Am i wrong in thinking that 1 degree of movement at the equator is different from 1 degree at 89 north?
Robert thank you so much for this blog. Would you be updating it with last year's data by any chance? That would be so amazing pretty please 🙏...