The SGPLOT procedure in SAS makes it easy to create graphs that overlay various groups in the data. Many statements support the GROUP= option, which specifies that the graph should overlay group information. For example, you can create side-by-side bar charts and box plots, and you can overlay multiple scatter
Tag: Tips and Techniques
I wrote more than 100 posts for The DO Loop blog in 2017. The most popular articles were about SAS programming tips, statistical data analysis, and simulation and bootstrap methods. Here are the most popular articles from 2017 in each category. General SAS programming techniques INTCK and INTNX: Do you
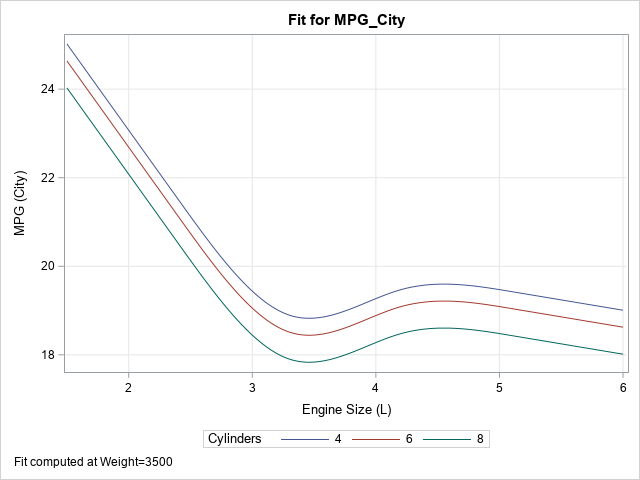
Slice, slice, baby! You've got to slice, slice, baby! When you fit a regression model that has multiple explanatory variables, it is a challenge to effectively visualize the predicted values. This article describes how to visualize the regression model by slicing the explanatory variables. In SAS, you can use the
Imputing missing data is the act of replacing missing data by nonmissing values. Mean imputation replaces missing data in a numerical variable by the mean value of the nonmissing values. This article shows how to perform mean imputation in SAS. It also presents three statistical drawbacks of mean imputation. How
A common question on discussion forums is how to compute a principal component regression in SAS. One reason people give for wanting to run a principal component regression is that the explanatory variables in the model are highly correlated which each other, a condition known as multicollinearity. Although principal component
In a large simulation study, it can be convenient to have a "control file" that contains the parameters for the study. My recent article about how to simulate multivariate normal clusters demonstrates a simple example of this technique. The simulation in that article uses an input data set that contains
When you implement a statistical algorithm in a vector-matrix language such as SAS/IML, R, or MATLAB, you should measure the performance of your implementation, which means that you should time how long a program takes to analyze data of varying sizes and characteristics. There are some general tips that can
The SAS analytical documentation has a new look. Beginning with the 14.2 release of the SAS analytical products (which shipped with SAS 9.4m4 in November 2016), the HTML version of the online documentation has moved to a new framework called the Help Center. The URL for the online documentation is
For SAS programmers, the PUT statement in the DATA step and the %PUT macro statement are useful statements that enable you to display the values of variables and macro variables, respectively. By default, the output appears in the SAS log. This article shares a few tips that help you to
Do you want to create customized SAS graphs by using PROC SGPLOT and the other ODS graphics procedures? An essential skill that you need to learn is how to merge, join, append, and concatenate SAS data sets that come from different sources. The SAS statistical graphics procedures (SG procedures) enable
Every year near Halloween I write an article in which I demonstrate a simple programming trick that is a real treat to use. This year's trick (which features the CMISS function and the crossproducts matrix in SAS/IML) enables you to count the number of observations that are missing for pairs
Graphs enable you to visualize how the predicted values for a regression model depend on the model effects. You can gain an intuitive understanding of a model by using the EFFECTPLOT statement in SAS to create graphs like the one shown at the top of this article. Many SAS regression
I got several positive comments about a recent tip, "How to fit a variety of logistic regression models in SAS." A reader asked if I knew any other similar resources about statistical analysis in SAS. Absolutely! One gem that comes to mind is "Examples of writing CONTRAST and ESTIMATE statements."
Optimization is a primary tool of computational statistics. SAS/IML software provides a suite of nonlinear optimizers that makes it easy to find an optimum for a user-defined objective function. You can perform unconstrained optimization, or define linear or nonlinear constraints for constrained optimization. Over the years I have seen many
SAS programmers sometimes ask, "How do I create a design matrix in SAS?" A design matrix is a numerical matrix that represents the explanatory variables in regression models. In simple models, the design matrix contains one column for each continuous variable and multiple columns (called dummy variables) for each classification
Last week Sanjay Matange wrote about a new SAS 9.4m3 option that enables you to show all categories in a graph legend, even when the data do not contain all the categories. Sanjay's example was a chart that showed medical conditions classified according to the scale "Mild," "Moderate," and "Severe."
A common question on SAS discussion forums is how to compute a moving average in SAS. This article shows how to use PROC EXPAND and contains links to articles that use the DATA step or macros to compute moving averages in SAS. In a previous post, I explained how to
Last week my colleague Chris Hemedinger published a blog post that described how to use the ODS LAYOUT GRIDDED statement to arrange tables and graphs in a panel. The statement was introduced in SAS 9.4m1 (December 2013). Gridded layout is supported for HTML, POWERPOINT, and the PRINTER family of destinations
Statistical programmers often need to evaluate complicated expressions that contain square roots, logarithms, and other functions whose domain is restricted. Similarly, you might need to evaluate a rational expression in which the denominator of the expression can be zero. In these cases, it is important to avoid evaluating a function
Every year near Halloween I write a trick-and-treat article in which I demonstrate a simple programming trick that is a real treat to use. This year's trick features two of my favorite functions, the CUSUM function and the LAG function. By using these function, you can compute the rows of
I've previously written about how to generate a sequence of evenly spaced points in an interval. Evenly spaced data is useful for scoring a regression model on an interval. In the previous articles the endpoints of the interval were hard-coded. However, it is common to want to evaluate a function
Statistical programmers often have to use the results from one SAS procedure as the input to another SAS procedure. Because ODS enables you to you to create a SAS data set from any ODS table or graph, it is easy to obtain a data set that contains the value of
The title of this blog post might seem strange, but I occasionally need to compute the number of digits in a number, usually because I am trying to stuff an integer value into a string. Each time, I have to derive the formula from scratch, so I am writing this
One of my presentations at SAS Global Forum 2015 was titled "Ten Tips for Simulating Data with SAS". The paper was published in the conference proceedings several months ago, but I recently recorded a short video that gives an overview of the 10 tips: If your browser does not support
When using SAS to format a number as a percentage, there is a little trick that you need to remember: the width of the formatted value must include room for the decimal point, the percent sign, and the possibility of two parentheses that indicate negative values. The field width must
Base SAS contains many functions for processing strings, and you can call these functions from within a SAS/IML program. However, sometimes a SAS/IML programmer needs to process a vector of strings. No problem! You can call most Base SAS functions with a vector of parameters. I have previously written about
I previously wrote about the best way to suppress output from SAS procedures. Suppressing output is necessary in simulation and bootstrap analyses, and it is useful in other contexts as well. In my previous article, I wrote, "many programmers use ODS _ALL_ CLOSE as a way to suppress output, but
SAS procedures can produce a lot of output, but you don't always want to see it all. In simulation and bootstrap studies, you might analyze 10,000 samples or resamples. Usually you are not interested in seeing the results of each analysis displayed on your computer screen. Instead, you want to
Did you know that if you have set multiple titles in SAS, that there is an easy way to remove them? For example, suppose that you've written the following statements, which call the TITLE statement to set three titles: title "A Great Big Papa Title"; title2 "A Medium-sized Mama Title";
When you have a long-running SAS/IML program, it is sometimes useful to be able to monitor the progress of the program. For example, suppose you need to computing statistics for 1,000 different data sets and each computation takes between 5 and 30 seconds. You might want to output a message