Last week my colleague Chris Hemedinger published a blog post that described how to use the ODS LAYOUT GRIDDED statement to arrange tables and graphs in a panel. The statement was introduced in SAS 9.4m1 (December 2013). Gridded layout is supported for HTML, POWERPOINT, and the PRINTER family of destinations (PDF, PS, and PCL). It is not supported for other destinations such as RTF or LISTING.
Chris's example arranged the output of ODS objects that were created by different procedures. It turns out that you can also use the ODS LAYOUT GRIDDED statement to arrange tables and graphs that are created by PROC IML, which is an interactive procedure. Because the ODS statement is a "global" statement in SAS, you can call it from within a SAS/IML program to display output horizontally across a page.
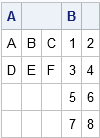
For example, suppose that you have two matrices of different sizes, but you want to display them side by side. If you use the PRINT statement, the output doesn't look very pretty in HTML. The PRINT statement essentially makes one big table to hold the two matrices. There is no space between the matrices, and it is hard to tell where one matrix ends and the other begins. The shorter matrix is padded with blank rows, as shown by the following output:proc iml;
A = {A B C, D E F};
B = {1 2, 3 4, 5 6, 7 8};
print A B; /* print matrices side by side */ |
The output has spaces in the LISTING destination, but I no longer use the LISTING destination, so I am interested in improving the look in HTML and other modern destinations.
The ODS LAYOUT GRIDDED statement solves this problem. You simply specify that ODS should display subsequent tables in a gridded configuration with two columns. You can use the ODS REGION statement every time you want to subsequent output to appear in a new column:/* gridded layout in HTML, POWERPOINT, and PDF */ ods layout gridded columns=2; ods region; /* display subsequent output in 1st column */ print A; ods region; /* display subsequent output in 2nd column */ print B; ods layout end; |
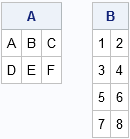
The HTML output is shown. The second matrix is positioned horizontally next to the first matrix. Notice that two PRINT statements are used. You can control the horizontal space between matrices by using the COLUMN_GUTTER= option on the ODS LAYOUT GRIDDED statement.
Actually, you can make it even simpler. You can use the ADVANCE=TABLE option on the ODS LAYOUT GRIDDED statement to specify that each table should automatically trigger an advancement to the next column. Consequently, you can omit the ODS REGION calls:
ods layout gridded columns=2 advance=table; print A; /* output in 1st column */ print B; /* output in 2nd column */ ods layout end; |
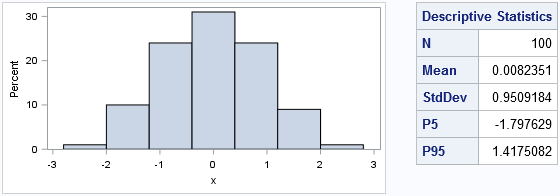
The same technique works for horizontally arranging graphical and tabular output. The following statements place a table next to a histogram. If you specify a TITLE statement, put it before the ODS LAYOUT GRIDDED statement.
call randseed(12345);
x = j(100,1);
call randgen(x, "Normal");
/* compute descriptive statistics for sample */
N = countn(x);
mean = mean(x);
std = std(x);
call qntl(q, x, {0.05 0.95});
desc = N // mean // std // q;
statNames = {N, "Mean", "StdDev", "P5", "P95"};

ods graphics / width=4in height=2in;
ods layout gridded columns=2 advance=table;
   call histogram(x);
   print desc[L="Descriptive Statistics" r=statNames];
ods layout end; |
As these examples demonstrate, the ODS LAYOUT GRIDDED statement is a powerful way to for a SAS/IML programmer to position output. Although it is not supported by all ODS destinations, it enables you to dynamically arrange output horizontally across the page in HTML and PDF destinations.
Can you think of imaginative ways to use the ODS LAYOUT GRIDDED statement to improve your SAS/IML output? Leave a comment.

3 Comments
Pingback: Dummy variables in SAS/IML - The DO Loop
Pingback: Advanced ODS: Controlling precisely what output is displayed - Graphically Speaking
Pingback: Advanced ODS: Controlling precisely what output is displayed - Graphically Speaking