Last week I showed how to create dummy variables in SAS by using the GLMMOD procedure. The procedure enables you to create design matrices that encode continuous variables, categorical variables, and their interactions. You can use dummy variables to replace categorical variables in procedures that do not support a CLASS statement. You can use other procedures to create design matrices for other parameterizations.
SAS/IML programmers can use two built-in functions to create dummy variables. The DESIGN function generates dummy variables for the GLM parameterization. The DESIGNF function generates dummy variables for the EFFECT encoding. You can use the HDIR function to create interaction effects from the main-effect dummy variables.
The following DATA step creates sample data. The PROC IML statements read the data into vectors and use the DESIGN and DESIGNF function to create dummy variables. Note the use of the ODS LAYOUT GRIDDED statement to print SAS/IML matrices across the page.
data Patients;
   keep Cholesterol Sex BP_Status;
   set sashelp.heart;
   if 18 <= _N_ <= 27;
run;

proc iml;
use Patients;
read all var {Cholesterol Sex BP_Status};
close Patients;

Dummy_GLM = design( BP_Status );      /* dummy vars, GLM encoding */
Dummy_Effect = designf( BP_Status );  /* dummy vars, EFFECT encoding */

ods layout gridded columns=3 advance=table; /* create gridded layout in HTML */
print BP_Status, Dummy_GLM, Dummy_Effect;
ods layout end; |
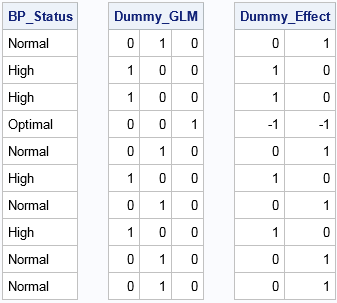
You can see that the DESIGN matrix creates k binary dummy variables for a categorical variable that contains k levels. The first column represents the first level (in alphabetical order), which for this data is "High." The first column has the value 1 for each row for which BP_Status="High." Similarly, the second column contains a 1 for each row for which BP_Status="Normal." The third column contains a 1 for each row for which BP_Status="Optimal."
In contrast, the DESIGNF creates a design matrix that has k–1 columns. The matrix has the EFFECT encoding, with the last category ("Optimal") serving as the reference level. The first column has the value 1 for rows for which BP_Status="High," the value –1 for rows for which BP_Status is the reference level, and 0 otherwise. The second column is similar, except that 1 indicates rows for which BP_Status="Normal."
Linear regression with dummy variables
Dummy variables convert character variables (and other categorical variables) into numerical variables with a specified encoding. As such they enable you to use matrix computations to perform a statistical analysis such as linear regression.
For example, the following SAS/IML statements perform a regression analysis that models the Cholesterol variable as a linear function of the Sex and BP_Status variables. The statements use the DESIGNF statement to form the dummy variables for each categorical variable. These columns (and an intercept column) are concatenated horizontally to form the design matrix. Because the DESIGNF statement is a nonsingular parameterization, you can use the SOLVE function to solve the normal equations and obtain the least squares solution, as follows:
Y = Cholesterol;                 /* response variable */
Intercept = j(nrow(Y), 1, 1);
X1 = designf( Sex );
X2 = designf( BP_Status );
X = Intercept || X1 || X2;      /* design matrix with EFFECT parameterization */

/* Matrix formulation of one-way ANOVA (cell means model): Y = X*beta + epsilon
   See https://en.wikipedia.org/wiki/Design_matrix       */
b = solve( X`*X, X`*Y );       /* solve normal equations */
print b[rowname={"Intercept" "Sex:Female" "BP_Status:High" "BP_Status:Normal"}]; |
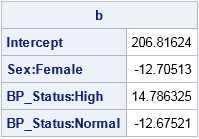
The interpretation of the parameter estimates for this linear example is somewhat complicated; see Lewis (2007) if you are interested. However, for comparison, the following call to PROC GENMOD creates parameter estimates for the same linear model. The PARAM=EFFECT option is used so that the procedure uses the EFFECT parameterization.
proc genmod data=Patients; class Sex BP_Status / param=effect; model Cholesterol = Sex BP_Status / noscale; ods select ParameterEstimates; run; |
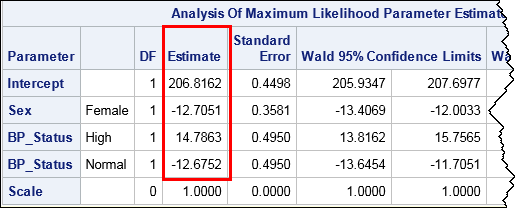
Strictly speaking, PROC GENMOD uses maximum likelihood estimation whereas the PROC IML code is a least squares estimate, but you can see that the estimates are identical to four decimal places.
Use dummy variables in SAS/IML to solve regression problems with class variables. #sastip Share on XREFERENCE encoding and the GLM parameter estimates
Although SAS/IML does not provide a built-in function for generating a design matrix that uses the REFERENCE encoding, you can easily create such a function. The REFERENCE encoding is similar to the GLM encoding, but with the (redundant) last column dropped:
/* design matrix for reference encoding */ start designr(x); A = design(x); /* get design matrix with GLM encoding */ return( A[,1:ncol(A)-1] ); /* drop last column */ finish; |
If you use the REFERENCE encoding to create the X matrix as in the previous section, then the SOLVE function returns the same parameter estimates that are provided by the GLM procedure. (The GLM procedure sets the parameters for the last dummy columns to zero.)
Interactions of dummy variables
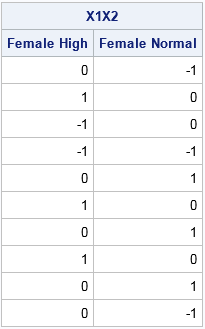
You can use the HDIR function to create interaction effects. For example, the following statements create columns that indicate the interaction between the Sex and BP_Status variables. The printed output shows the results for the EFFECT parameterization, but the same SAS/IML statement will produce the interaction effects for other parameterizations:
X1X2 = hdir(X1, X2);   /* dummy variables for interaction term */
print X1X2[c={"Female High" "Female Normal"}]; |
By using the tips in this article, you can create design matrices for ANOVA and regression models that contain categorical variables. In this way, you can use SAS/IML to reproduce the parameter estimates in many SAS linear regression procedures.

12 Comments
The tip about printing matrices side by side is awesome.
Rick,
I want know if these design matrices could be used in proc distance or proc fastclus or proc cluster to do some clustering analysis when you have both character variables and numeric variables?
Yes and no. People do use dummy variables in multivariate analyses, but the interpretations do not always make sense. For example, you meantion clustering. If you create a dummy variable for the Sex variable so that Female=0 and Male=1, what does it mean if a procedure reports that the center of a multivariate cluster has coordinate Sex=0.666? It means that the cluster has twice as many males as females. However, the Euclidean distance between clusters no longer has any meaning.
Hi Rick,
Could you please explain how we can say that the cluster has twice as many males as females if we code M=1 and F=0 and the cluster center is 0.666? Thanks!
Personally, I wouldn't call this a cluster problem. It is simply an arithmetic mean. Let N1=number of males and N2=number of females. Then the mean of the coding vector is (N1*1 + N2*0)/(N1+N2). Set this equal to 2/3 and solve algebraically for N1.
Thanks Rick, a very interesting article. How about using the DESIGN function to tabulate the data?
.
print (design(BP_Status)`* design(Sex)) [ rowname=(unique(BP_Status)) colname=(unique(Sex)) ];
You must have read my mind! I started to write a section about how to use design matrices for descriptive statistics, but the article became too long. In addition to your cross-tabulation trick, you can use the dummy variables to compute univariate means and standard deviations for continuous variables for each level of the classification variable. The following example computes the means and standard deviation for the MPG_City variable for each TYPE of vehicle in the Sashelp.Cars data. There are no loops, so this trick is competitive with UNIQUE-LOC trick for BY-group analysis.
proc iml; use sashelp.cars; read all var "Type" into c; read all var "MPG_City" into mpg; close sashelp.cars; D = design(c); cat = unique(c); /* want simple statistics for each kind of vehicle? Look, Ma, no loop! */ n = D[+, ]; /* counts for each level */ M = mpg # D; /* split contin var by classification levels */ mean = M[+, ] / n; var = (M - mean#D)[##, ] / (n-1); stddev = sqrt(var); print (n // mean // stddev)[c=cat r={N "Mean" "Std Dev"}];It's a nice idea we have had! In practice, I think we will soon run into problems with missing values. A numeric TYPE variable with missing values will kill everything dead as missing values are invalid input into DESIGN, also your descriptive statistics will be calculated using the wrong counts if the MPG variable has missing values.
Should the DESIGN function have an option to allow a missing category? Should there be a TABULTATE function designed specifically for 1-way and 2-way tabulations?
Yes, missing values alway complicate matrix computations.
I belive that the DESIGN function already supports the "missing category" and adds an additional column (the first column) to the design matrix. The existing TABULATE CALL is valid for one-way tabulations. With work, you can write a module that extends TABULATE to two-way tables, but it should be easier. Your trick of using the cross-product of the design matrices is simpler.
Rick, I had completely forgot about CALL TABULATE, should have checked the docs first! But if I try d = design({1, 2, 2, ., 1}); then I get the error 'Invalid argument or operand; contains missing values'. I am using 13.1.
You are correct. I guess that makes sense because in a regression context missing values in an explanatory variable need to be dropped from the analysis.
Pingback: Four ways to create a design matrix in SAS - The DO Loop