The ODS statement controls most aspects of how SAS creates your output results. You use it to specify the destination type (HTML, PDF, RTF, EXCEL or something else), as well as the details of those destinations: file paths, appearance styles, graphics behaviors, and more. The most common use pattern is the "ODS sandwich." In this pattern, you open the destination with the ODS statement, then include all of the code that generates the substance of the output, and then use an ODS CLOSE statement to finish it off. Here's a classic example:
ods html file="c:\project\myout.html" /* top slice of bread */ style=journal gpath="c:\project"; proc means data=sashelp.class; /* the "meat" */ run; proc sgplot data=sashelp.class; histogram weight; run; ods html close; /* bottom slice */ |
But did you know that you can insert more ODS statements to adjust ODS behavior midstream? These allow you to use a variety of ODS behaviors within a single result. You can create your own "Dagwood sandwich" version of SAS output! For cultural reference:
Dagwood sandwich: A Dagwood is a tall, multi-layered sandwich made with a variety of meats, cheeses, and condiments. It was named after Dagwood Bumstead, a central character in the comic strip Blondie, who is frequently illustrated making enormous sandwiches. Source: Wikipedia
Here's an example program that changes graph style and title behavior within a single ODS output file. You should be able to try this code in any SAS programming environment.
ods _all_ close; %let outdir = %sysfunc(getoption(WORK)); ods graphics / width=400 height=400; ods html(id=dagwood) file="&outdir./myout.html" style=journal gtitle gpath="&outdir."; title "Example ODS Dagwood sandwich"; proc means data=sashelp.class; run; ods layout gridded columns=2; ods region; ods html(id=dagwood) style=statdoc ; proc sgplot data=sashelp.class; title "This title is part of the graph image, Style=STATDOC"; histogram weight; run; ods region; ods html(id=dagwood) style=raven nogtitle; title "This title is in the HTML, Style=RAVEN"; proc sgplot data=sashelp.class; histogram height; run; ods layout end; ods html(id=dagwood) close; |
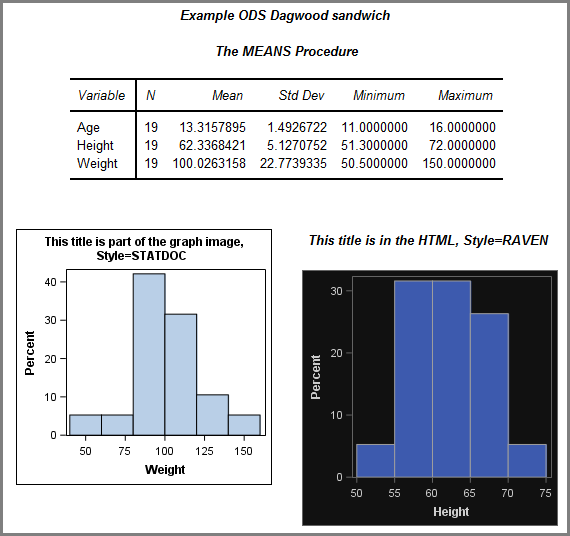 Here's the result, plus some important items to note about this technique.
- It's a good practice to distinguish each ODS destination with an ID= value. This allows you to reference the intended ODS stream with no ambiguity. After all, you can have multiple ODS destinations open at once, even multiple destinations of the same type. In my example, I used ID=dagwood to make it obvious which destination the statement applies to.
- You can use this technique to modify only those directives that can change "mid-file" to apply to different parts of the output. You can't modify those items that apply to the entire file, such as PATH, ENCODING, STYLESHEET and many more. These can be set just once when you create the file; setting multiple different values wouldn't make sense.
You can use this technique within those applications that generate ODS statements for you, such as SAS Enterprise Guide. For example, to modify the default SAS Enterprise Guide HTML output "midstream", add a statement like:
ods html(id=eghtml) /*... plus your options, like STYLE=*/ ;
ods html(eghtml) /* this shorthand works too */ ;
In SAS Studio or SAS OnDemand for Academics, try this:
ods html5(id=web) /*... plus your options, like STYLE=*/ ;
ods html5(web) /* this shorthand works too */ ;
Example: an ODS Graphics style sampler
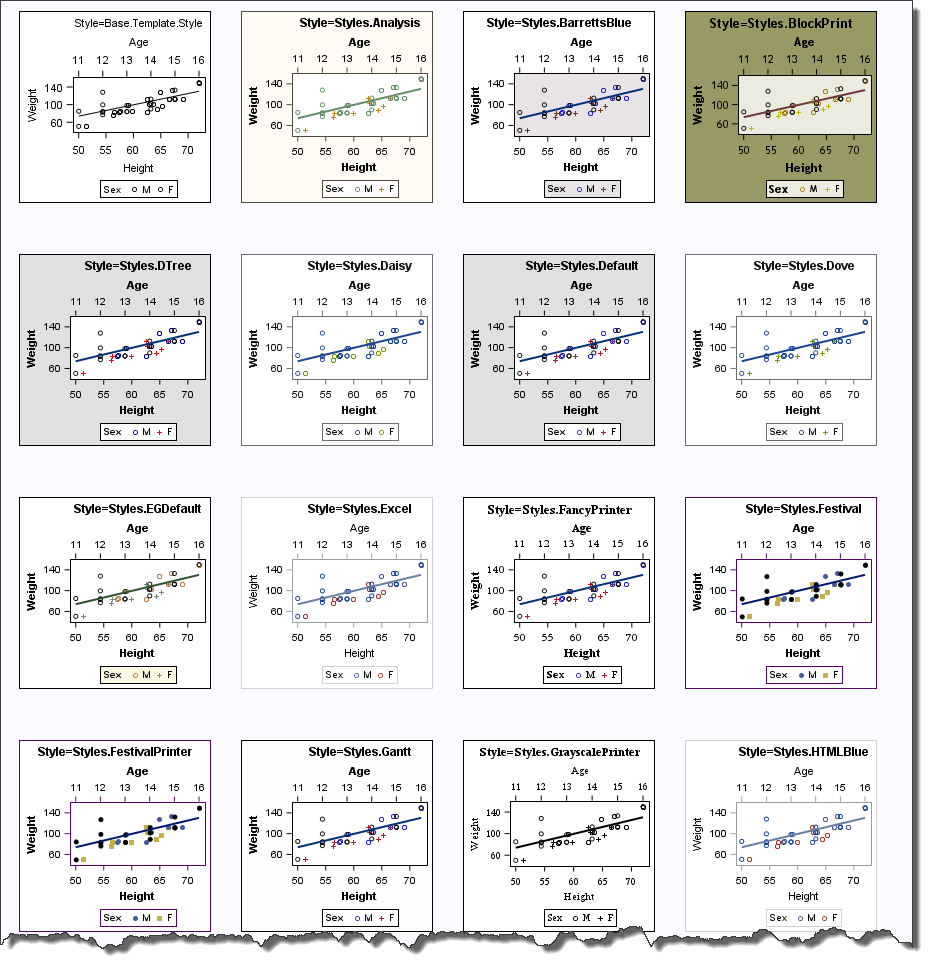 Here's one more example that puts it all together. Have you ever wanted an easy way to check the appearance of the dozens of different built-in ODS styles? Here's a SAS macro program that you can run in SAS Enterprise Guide (with the HTML result on) that generates a "sampler" of graphs that show variations in fonts, colors, and symbols across the different styles.
This example uses ODS LAYOUT (production in SAS 9.4) to create a gridded layout of example plots. If you want to try this in SAS Studio or in SAS OnDemand for Academics, you can adjust one line in the program (as noted in the code comments).
/* Run within SAS Enterprise Guide */ /* with the HTML result option turned ON */ %macro styleSampler; title; proc sql noprint; select style into :style1-:style99 from sashelp.vstyle where libname="SASHELP" and memname="TMPLMST"; ods layout gridded columns=4; ods graphics / width=300 height=300; %do index=1 %to &sqlobs; ods region; ods html(eghtml) gtitle style=&&style&index.; /* In SAS Studio, use this instead: */ /* ods html5(web) gtitle style=&&style&index.; */ title "Style=&&style&index."; proc sgplot data=sashelp.class; scatter x=Height y=Weight /group=Sex; reg x=Age y=Weight / x2axis; run; %end; ods layout end; %mend; %styleSampler; |
See also
Take control of ODS results in SAS Enterprise Guide
Best way to suppress ODS output in SAS
Advanced ODS Graphics techniques: a new free book

11 Comments
In addition to your %styleSampler macro, you can view the SAS/STAT documentation to compare how various graphical elements vary among ODS styles.
I first read through the consolidated daily listing of blog contents that comes as email.
Why was I not surprised when it linked to a blog written by Chris???? Great job of making this entertaining and giving a wonderful way of remembering what this ODS stuff is all about. My first Dagwood was when I forgot to put an "ODS PDF close" at the point I should have. Big sandwich!
I am going to reference this in a SGF 2016 paper I am doing on Proc Document. Do I have your permission Chris??
Roger, of course you can reference this blog -- I'll be honored to make a small appearance in your conference paper.
This is very cool. I was not aware of the ODS LAYOUT GRIDDED statement. Gridded layout is supported for HTML, POWERPOINT, and PRINTER destinations (PDF, PS, and PCL).
Hi Chris,
I want to make you a question about SAS/EG:
I have a process made in SAS/BASE coding that I want to do now in SAS/EG using workflow. I have to do a logistic regression. In my below code you can see that I run a logistic regression (training dataset), save the modelo and after I apply my model with other dataset (validation)
proc logistic data=test outmodel=modelo plots=ROC;
class cod_tarifa productos; model hc_consumo=cod_tarifa productos;
quit;
/* /* Apply model*/
proc logistic inmodel=modelo;
score data=validar out=validar1;
quit;
I am trying to do it with logistic regression task in a workflow. I can select target variable (hc_consumo) and features (cod_tarifa productos), but I don't know haw to save the model, and how to apply after hist model, is it possible in a SAS/EG guided task.
Any advice will be greatly appreciated
Thanks Chris
Juan
Hi Juan,
I don't have an answer for you, but I see you've asked the same question on the SAS Support Communities. Hopefully an expert will chime in on that discussion.
I am trying to implement this and get an output that is Excel compatible. I changed the file to myout.xls, and the two graphs overlap. Any thoughts on how to get a "cleaner" result?
I also do not get a title on the Raven graph, and the Raven style doesn't look anything like yours.
EG6.1 and Excel 10.
"Raven" was added in SAS 9.4. And ODS EXCEL was also added in SAS 9.4m2, and ODS LAYOUT was also improved in later versions of SAS 9.4. If you're using EG 6.1, maybe you have SAS 9.3 or an earlier SAS 9.4? If so, I think that might explain the layout and title issues you see.
Pingback: Arrange matrices and graphs in a gridded layout - The DO Loop
Pingback: Advanced ODS: Controlling precisely what output is displayed - Graphically Speaking
Pingback: Advanced ODS: Controlling precisely what output is displayed - Graphically Speaking