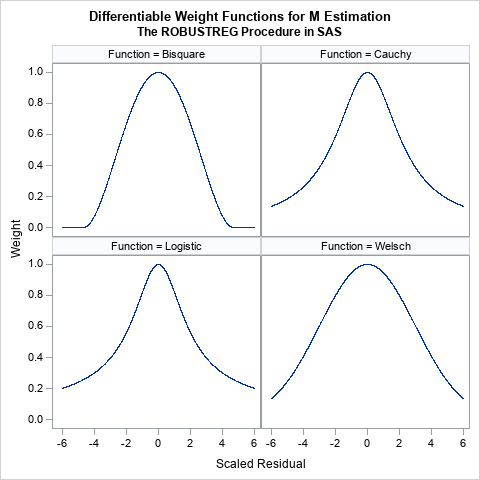
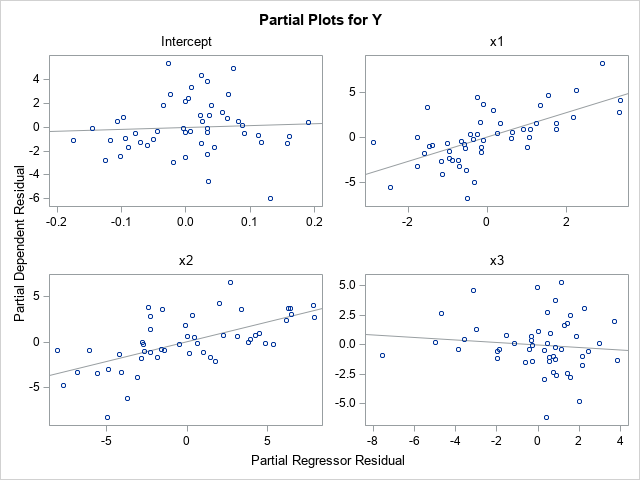
Tag: linear regression

Analytics
Rick Wicklin 0
Should you use principal component regression?

This article describes the advantages and disadvantages of principal component regression (PCR). This article also presents alternative techniques to PCR. In a previous article, I showed how to compute a principal component regression in SAS. Recall that principal component regression is a technique for handling near collinearities among the regression

Analytics | Learn SAS
Rick Wicklin 0
Principal component regression in SAS

A common question on discussion forums is how to compute a principal component regression in SAS. One reason people give for wanting to run a principal component regression is that the explanatory variables in the model are highly correlated which each other, a condition known as multicollinearity. Although principal component

Advanced Analytics | Programming Tips
Makoto Unemi (畝見 真) 0
SAS Viyaで線形回帰

SAS Viyaで線形回帰を行う方法を紹介します。 言語はPythonを使います。 SAS Viyaで線形回帰を行う方法には大きく以下の手法が用意されています。 多項回帰: simpleアクションセットで提供。 一般化線形回帰または一般線形回帰: regressionアクションセットで提供。 機械学習で回帰: 各種機械学習用のアクションセットで提供。 今回は単純なサインカーブを利用して、上記3種類の回帰モデルを作ってみます。   【サインカーブ】 -4≦x<4の範囲でサインカーブを作ります。 普通に $$y = sin(x) $$を算出しても面白みがないので、乱数を加減して以下のようなデータを作りました。これをトレーニングデータとします。 青い点線が $$y=sin(x)$$ の曲線、グレーの円は $$y=sin(x)$$ に乱数を加減したプロットです。 グレーのプロットの中心を青い点線が通っていることがわかります。 今回はグレーのプロットをトレーニングデータとして線形回帰を行います。グレーのプロットはだいぶ散らばって見えますが、回帰モデルとしては青い点線のように中心を通った曲線が描けるはずです。 トレーニングデータのデータセット名は "sinx" とします。説明変数は "x"、ターゲット変数は "y" になります。 各手法で生成したモデルで回帰を行うため、-4≦x<4 の範囲で0.01刻みで"x" の値をとった "rangex" というデータセットも用意します。 まずはCASセッションを生成し、それぞれのデータをCASにアップロードします。 import swat host = "localhost" port = 5570 user = "cas" password = "p@ssw0rd"

Rick Wicklin 0
Dummy variables in SAS/IML

Last week I showed how to create dummy variables in SAS by using the GLMMOD procedure. The procedure enables you to create design matrices that encode continuous variables, categorical variables, and their interactions. You can use dummy variables to replace categorical variables in procedures that do not support a CLASS

Rick Wicklin 0
Four ways to create a design matrix in SAS

SAS programmers sometimes ask, "How do I create a design matrix in SAS?" A design matrix is a numerical matrix that represents the explanatory variables in regression models. In simple models, the design matrix contains one column for each continuous variable and multiple columns (called dummy variables) for each classification

Learn SAS
Rick Wicklin 0
Create dummy variables in SAS

A dummy variable (also known as indicator variable) is a numeric variable that indicates the presence or absence of some level of a categorical variable. The word "dummy" does not imply that these variables are not smart. Rather, dummy variables serve as a substitute or a proxy for a categorical

Rick Wicklin 0
How to interpret a residual-fit spread plot

In a previous blog post, I described how to use a spread plot to compare the distributions of several variables. Each spread plot is a graph of centered data values plotted against the estimated cumulative probability. Thus, spread plots are similar to a (rotated) plot of the empirical cumulative distribution