Argh! I've just spilled coffee on output that shows the least squares coefficients for a regression model that I was investigating. Now the parameter estimate for the intercept is completely obscured, although I can still see the parameter estimates for the coefficients of the continuous explanatory variable. What can I do? Do I need to rerun the regression in order to recover the estimate for the intercept term?
No, it turns out that I do not. If I know (or can compute) the mean values of the response variable and the explanatory variables, then that is enough information to recreate the intercept estimate.
A formula for the intercept of a regression model
In high school or college, you might have learned a simple formula for computing the intercept for a one-variable regression model. If my is the mean of the response variable, mx is the mean of the explanatory variable, and b is the slope of the least square regression line, then the intercept is computed as b0 = my − b mx.
For multivariate regression with several continuous variables, the formula is similar: b0 = my − Σibi mi, where mi is the mean of the ith explanatory variable. In vector notation, if b is the vector of coefficients for the explanatory variables and mx is the corresponding vector of means, then you can use the inner product operator to compute the intercept: b0 = my − b*mx.
Math saves the day
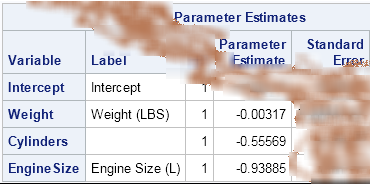
Let's see how this works on my coffee-stained example. The original analysis was created by using this regression model in PROC REG:
proc reg data=sashelp.cars; model Mpg_city = Weight Cylinders EngineSize; ods select ParameterEstimates; quit; |
Rather than rerun the regression, I'll use the SAS/IML language to compute the means of the relevant variables, and use the inner product formula to obtain the estimate for the intercept term. In practice, you might also need to take care of two additional details:
- The REG procedure excludes observations for which any explanatory variable is missing. If your data contain missing values, remove the rows of your data that have missing values. One way to do it is to use the COUNTMISS function in the SAS/IML language to exclude the rows with missing values.
- The ParameterEstimates table displays the parameter estimates in a format that aligns the decimal points, but does not necessarily represent the full precision of the coefficients. Because I want the following PROC IML statements to give exactly the same estimate for the intercept term as reported by PROC REG, I used additional digits of precision for the coefficient of the WEIGHT variable.
proc iml;
use sashelp.cars;
read all var {Weight Cylinders EngineSize} into X;  /* read explanatory vars */
read all var {Mpg_city} into Y;                     /* read response var */
close sashelp.cars;

/* include only complete cases (exclude missing) */
idx = loc(countmiss(X, "row")=0);
X = X[idx, ];
Y = Y[idx, ];

xBar = mean(X);                         /* row vector of means for X */
yBar = mean(Y);                         /* mean of Y */
b = {-.003165747, -0.55569, -0.93885};  /* regression coefficients for X */
b0 = yBar - xBar * b;                   /* recover intercept term */
print b0; |

The output shows that the intercept term for this multivariable regression is about 37.6. If you run the REG procedure, you obtain the same estimate.
Why should you care?
Okay, you might have guessed by now that I didn't really spill coffee on a piece of paper, so why did I go through this exercise? It is faster and easier to simply rerun PROC REG. Why go to the trouble of computing the interept estimate in terms of the means of the variables?
The reason is that some regression problems are easier to solve if you not only center the explanatory variables but also center the response variable. The centering operation results in a solution that passes through (0,0). In other words, the y-intercept term is zero. However, by using the trick in this article, you can "recover" the intercept term for the uncentered data by using the simple linear operation that I've described here. In a future article, I'll apply this trick to solving a problem that uses ridge regression. That article won't feature any spilled coffee, but the trick will be useful anyway.

1 Comment
Pingback: Understanding ridge regression in SAS - The DO Loop