Data for Good: Galapagos sea turtle recognition

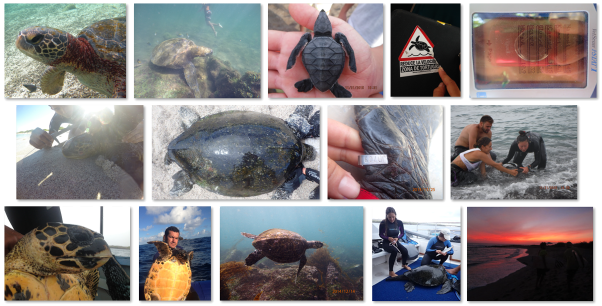
Can we use Computer Vision (CV) to recognize the identity of over 500 Galapagos sea turtles by using just an image? This was the question asked of SAS by researchers at the Galapagos Science Center (GSC), a joint partnership between the University of North Carolina at Chapel Hill’s (UNC) Center for