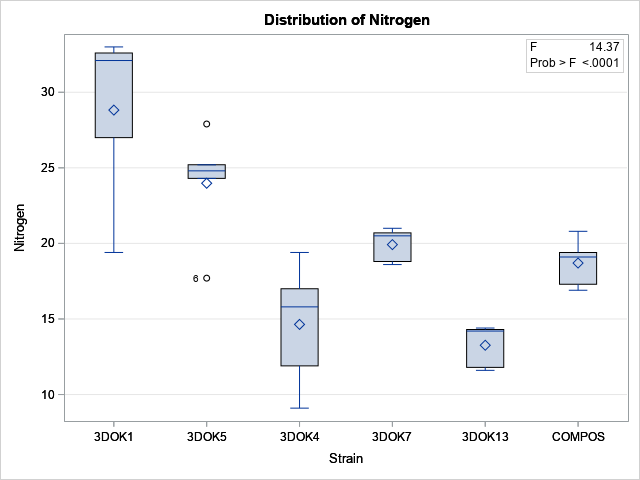
![Businessman considering the principles of data management for analytics](https://blogs.sas.com/content/datamanagement/files/2018/11/565888093.jpg)
Joyce Norris-Montanari cites five things she considers essential to data management for analytics.
The SGPLOT procedure enables you to use the value of a response variable to color markers or areas in a graph. For example, you can use the COLORRESPONSE= option to define a variable whose values will be used to color markers in a scatter plot or cells in a heat
One would expect analytics in government to be a hot topic at a SAS government event. What the crowd didn't see coming was Margaret Weichert, Acting Director of the US Office of Personnel Management and Deputy Director for Management at the Office of Management and Budget, touting her ability to
보험 업계는 변화에 느리다는 평을 받는 보수적인 산업이지만 지난 5년간 엄청난 변화와 혁신을 경험하고 있습니다. 보험사들은 고객과 유통 관계에서 혁신을 모색하며 디지털 이니셔티브에 많은 투자를 하고 있는데요. 이와 함께 데이터 분석, 인공지능 등의 정보기술(IT)을 활용해 기존 보험 산업을 혁신하는 인슈어테크(insurtech)가 디지털 기회를 활용할 수 있는 보험 업계의 새로운 분야로 떠오르고
With the recent midterm elections here in the US, I frequently saw congressional district maps popping up in the news. And being a GraphGuy, I wanted to fully understand these maps, to see if I might could improve them. If you're interested in congressional district maps, follow along as I
Phil Simon chimes in with some tips on how to set these folks loose.
Fall…it’s my favorite time of year. The air is crisp, the leaves are colorful and exercising outdoors is once again appealing. Most of all, its this time of year that I turn my attention to one of my favorite events of the year: #GivingTuesday. While Cyber Monday and Black
When solving optimization problems, it is harder to specify a constrained optimization than an unconstrained one. A constrained optimization requires that you specify multiple constraints. One little typo or a missing minus sign can result in an infeasible problem or a solution that is unrelated to the true problem. This
With today being an election day here in the US, I see a lot of people wearing the 'I Voted' sticker. This got me wondering if I could create my own sticker ... using SAS software and simple graphics primitives. :-) So I started by using Proc Gslide to create
I've collected accelerometer data with a third-party app. I've used some SAS tricks to import all of my data readings in a single step. Now I'm ready to create a report of these data in SAS Visual Analytics.
인공지능(AI)은 1950년대부터 머신러닝, 링크 걸기 시작 딥러닝(deep learning), 인지 컴퓨팅(cognitive computing)이 점차 발전하면서 우리와 꽤 오랜 시간을 함께 해왔습니다. 최근 달라진 점이 있다면 아마 활용할 수 있는 데이터의 양이 어마어마하게 늘었다는 것인데요. 방대한 양의 데이터 덕분에 오늘날 과거에는 불가능했던 방식으로 인공지능 기반의 모델을 학습시킬 수 있게 되었습니다. 이러한 인공지능은 지금의 세상과 거대한 데이터를 이해하는
What’s the most important component of analytic analysis? The data? The model? The deployment? Getting the business problem right? All the above? Or does it simply depend on who you ask? While the model gets all the attention, and the data requires most of the effort, there is that step
Will the real Pareto distribution please stand up? SAS supports three different distributions that are named "Pareto." The Wikipedia page for the Pareto distribution lists five different "Pareto" distributions, including the three that SAS supports. This article shows how to fit the two-parameter Pareto distribution in SAS and discusses the
Who says technical people can't have fun!?! Similar to Throwback Thursday / #TBT (when people post one of their old/nostalgic photos on social media), I like the tradition of Fun Friday when I use a fun data topic to test our software - a test can be just as rigorous using
Health care is facing an unprecedented need to reform, drive quality and cut costs. Growth in targeted, specific treatments and diagnostic technology, coupled with a rise in people with long-term and multiple chronic conditions, is creating unsustainable demand on the system. To thrive – or even merely survive – health
Mein Name ist Daniel und ich bin in der vierten Klasse. Diese Woche wurden die Eltern in meine Schule eingeladen, um uns etwas über ihre Arbeit zu erzählen. Und mein Vater war mit dabei. Am Anfang war ich etwas unsicher, ob ich mich darüber freuen sollte. Denn wenn sein Vortrag
SASでは、従来からオープン・AIプラットフォームであるSAS Viyaの機能をPythonから効率的に活用いただくためのハイレベルなPython向けAPIパッケージであるDLPyを提供してきました。 従来のDLPyは、Viya3.3以降のディープラーニング(CNN)と画像処理(image action set)のために作成された、Python API向けハイレベルパッケージです。 DLPyではKerasに似たAPIを提供し、より簡潔なコーディングで高度な画像処理やCNNモデリングが可能でした。 そして、この度、このDLPyが大幅に機能拡張されました。 最新版DLPy1.0では、以下の機能が拡張されています。 ■ 従来からの画像データに加え、テキスト、オーディオ、そして時系列データを解析可能 ■ 新たなAPIの提供: ・ RNN に基づくタスク: テキスト分類、テキスト生成、そして 系列ラベリング(sequence labeling) ・ 一般物体検出(Object Detection) ・ 時系列処理とモデリング ・ オーディオファイルの処理と音声認識モデル生成 ■ 事前定義ネットワーク(DenseNet, DarkNet, Inception, and Yolo)の追加 ■ データビジュアライゼーションとメタデータハンドリングの拡張 今回はこれらの拡張機能の中から「一般物体検出(Object Detection)」機能を覗いてみましょう。 SAS Viyaでは従来から画像分類(資料画像1.の左から2番目:Classification)は可能でした。例えば、画像に映っている物体が「猫」なのか「犬」なのかを認識・分類するものです。 これに加えて、DLPy1.0では、一般物体検出(資料画像1.の左から3番目:Object Detection)が可能になりました。 資料画像1. (引用:Fei-Fei Li & Justin Johnson & Serena Yeung’s Lecture
We have updated our software for improved interpretability since this post was written. For the latest on this topic, read our new series on model-agnostic interpretability. While some machine learning models – like decision trees – are transparent, the majority of models used today – like deep neural networks, random forests, gradient boosting
Artificial intelligence often seems misunderstood, especially in fraud. The same is true of machine learning. One of the amazing things about them is they ask the unasked questions. This occurs as artificial intelligence (AI) and machine learning (ML) go about their daily work. So, what is the unasked question? Too
President Donald Trump - people seem to either love him or hate him. Which makes for an interesting data-analysis topic ... tracking Trump's approval rating. Follow along as I explore some data! I'll start with what I consider the 'best' approval-rating graph I've found so far. Here's a screen-capture of
Jim Harris says people still play a pivotal role in data-driven decision making.
What skills will students need in order to pursue a lucrative career in analytics? I recently interviewed two professors to find out. In my first post, the professors discussed the importance of teaching and learning analytics. Today, we'll hear their top advice for students studying analytics, such as: get a
A useful feature in PROC SGPLOT is the ability to easily visualize subgroups of data. Most statements in the SGPLOT procedure support a GROUP= option that enables you to overlay plots of subgroups. When you use the GROUP= option, observations are assigned attributes (colors, line patterns, symbols, ...) that indicate
Vor ein paar Wochen hat das erste deutsche SAS User Group Meetup in Berlin stattgefunden. Dort hatte ich die Gelegenheit, mit Igor Khorlo, Senior Statistical Programmer bei Syneos Health Deutschland und Gründer der SAS User Group Germany (SUGG), über seine Motivation zu sprechen, die Gruppe ins Leben zu rufen –
Note: Today’s utility industry is in upheaval. All of the assumptions the business has run on have been turned on their heads. This post is the second in a three-part series looking at how analytics are helping utilities navigate this challenging landscape and find new opportunities for improvements in operations,
FRTB(Fundamental review of the trading book)는 은행의 시장 리스크 관리 방식을 바꿀 것입니다. 바젤은행감독위원회(BCBS)가 FRTB를 발표하고 이 기준에 따라 전세계적으로 시장 리스크를 측정해 공시하도록 한 것인데요. 대다수 은행은 2020년 12월 데드라인과 바뀌고 있는 요구 사항을 보며 ‘기다려야 한다’는 결론을 내리고 있지만, 그저 기다리기만 하는 것은 위험한 전략이 될 수 있습니다. 금융
I’m on day 8 of my 10 day sabbatical from running. By day 3, I already felt anxious about not lacing up my shoes and heading out to feel the wind in my face, never mind the fact that I was still exhausted and sore from the previous week’s races.
GAHHHHHHHHH! My screams filled the office hallways on a Sunday afternoon. In agony, I hopped to the ice machine to find relief for my crushed toe. Moments before, while hanging my shiny new patent plaque on the wall, it dropped six feet and landed on my big toe joint. Since
Erst kürzlich habe ich mich mit Thomas Gartzen, Geschäftsführer des European 4.0 Transformation Center, unterhalten. Dabei ging es neben Innovation Labs auch um Change Management und darum, wie sich ein analytischer Ansatz in Unternehmen umsetzen lässt. Andreas Gödde: Thomas, kann man sagen, dass jetzt alle Unternehmen Softwareunternehmen sind? Thomas Gartzen: