At SAS, we've worked hard to transform ourselves into an analytical marketing organization. And it's an ongoing journey. As new tools and data sources appear, we'll continue to grow, change and improve. As the leader of this effort, I wish there had been a how-to guide available when we started
Uncategorized
A hot button issue this election season was the need to determine the eligibility of people for various government programs like the Affordable Care Act (ACA), Medicare and Medicaid, or entry into the United States as a migrant refugee. “Look, we’re facing the worst refugee crisis since the end of
There are no limitations for what you can accomplish. That’s the message Keith Poston from the Friends of the North Carolina Museum of Natural Sciences imparted to 300 middle and high school students, teachers and parents assembled this week at the museum for the fourth STEM Career Showcase for Students
It's that time of year again where almost 50 million Americans travel home for Thanksgiving. We'll share a smorgasbord of turkey, stuffing and vegetables and discuss fun political topics, all to celebrate the ironic friendship between colonists and Native Americans. Being part Italian, my family augments the 20-pound turkey with pasta –
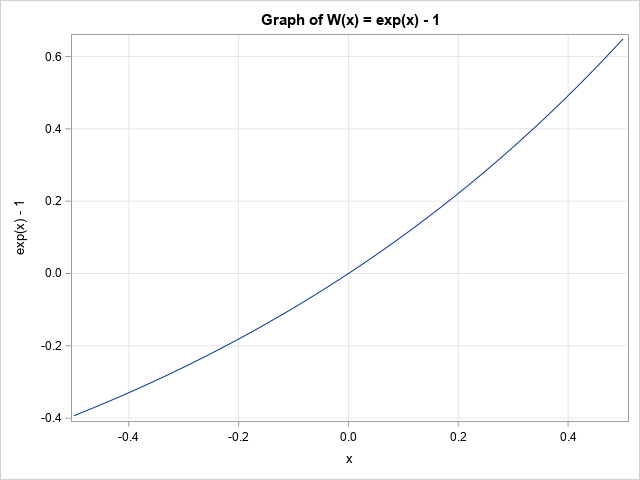
At a conference last week, a presenter showed SAS statements that compute the logarithm of a probability density function (PDF). The log-PDF is a a common computation because it occurs when maximizing the log-likelihood function. The presenter computed the expression in SAS by using an expression that looked like y
Are you the lone-wolf SAS programmer in your company - managing the data, performing the analyses, and graphing the output for everyone else? And what's the only format they all know how to work with, and wish they had your output in? Let's face it ... that's probably an Excel
Rick Wicklin showed us how to visualize the ages of US Presidents at the time of their inaugurations. That's a pretty relevant thing to do, as the age of the incoming president can indirectly influence aspects of the president's term, thanks to health and generational factors. As part of his
International Fraud Awareness Week is here! I know, I know… Fraud Week is not quite as exciting as Shark Week. It doesn’t appeal to your taste buds like Restaurant Week. Nor does it have the quirky feel of Brain Awareness Week (nope… I’m not making that one up!!). Nevertheless, Fraud Week is
Criminal enterprises are tapping into the lucrative opioid business through creative schemes that are less likely to be identified as opioid abuse, misuse or diversion. One of the latest schemes? Auto insurance fraud. First, some background… While extensive progress has been made in establishing, improving, and mandating prescription drug monitoring
On June 22nd, the U.S. Department of Justice announced the largest Medicaid fraud bust in history. The National Health Care Fraud Takedown included 301 defendants charged, $900 million in false billings, 61 medical professionals and 29 doctors, across 36 states. In another case, investigators in New York uncovered more than
Currently, most fraud detection solutions for financial crime and tax fraud are focused on risk assessing entities. That is to say, they evaluate the risk of each individual or businesses separately. While this helps prioritize risk-based investigations by alerting investigators to the likelihood of fraud, it does not necessarily maximize deterrence.
I've supplied dozens of custom tasks for SAS Enterprise Guide, but the Copy Files task is easily the most popular. The Copy Files task allows you to capture "file transfer" steps inside your process flow, so that you can automate any file upload and download operations between your PC and
.@philsimon says don't treat data self-service as a binary.
Who was the oldest person elected president of the United States? How about the youngest? Who was the oldest when he left office? Let's look at some data. Wikipedia has a page that presents a table of the presidents of the US by age. It lists the dates for which
Does it seem like there just aren't enough daylight hours to get things done these days? It might not be that you've got more to do - it might be that we actually have fewer daylight hours in the winter (here in the northern hemisphere). And since "seeing is believing,"
If you obtain data from web sites, social media, or other unstandardized data sources, you might not know the form of dates in the data. For example, the US Independence Day might be represented as "04JUL1776", "07/04/1776", "Jul 4, 1776", or "July 4, 1776." Fortunately, the ANYDTDTE informat makes it
Retail isn't an easy place to be these days. The environment is omnichannel and ever-changing. Competition is rising and retailers are struggling to understand how to best meet customers’ merchandise preferences. Fortunately, analytics are driving profitability and market share for smart retailers. Let’s take a look at the four hottest
We often talk about full customer data visibility and the need for a “golden record” that provides a 360-degree view of the customer to enhance our customer-facing processes. The rationale is that by accumulating all the data about a customer (or, for that matter, any entity of interest) from multiple sources, you
The Data For Good initiative is all about using data and analytics to improve the lives of citizens around the world – however most people wouldn’t immediately think about tax collection as a humanitarian effort. But that’s exactly how Courtney Kay-Decker, Executive Director of the Iowa Department of Revenue sees
In the US presidential election, each of the 50 states has a certain number of electoral votes, based on the population. Typically, most states cast all their electoral votes for the candidate who wins in their state (all or nothing). But states can split their electoral votes if they want
This article uses graphical techniques to visualize one of my favorite geometric objects: the surface of a three-dimensional torus. Along the way, this article demonstrates techniques that are useful for visualizing more mundane 3-D point clouds that arise in statistical data analysis. Define points on a torus A torus is
Anteriormente al hablar sobre la implementación de soluciones de business analytics en las empresas, se consideraba necesario invertir grandes cantidades de capital en hardware especializado para alcanzar los resultados deseados, sin embargo, hoy en día gracias a los avances tecnológicos ha sido posible acabar por completo con este inconveniente. La
Most enterprises employ multiple analytical models in their business intelligence applications and decision-making processes. These analytical models include descriptive analytics that help the organization understand what has happened and what is happening now, predictive analytics that determine the probability of what will happen next, and prescriptive analytics that focus on
Rotation matrices are used in computer graphics and in statistical analyses. A rotation matrix is especially easy to implement in a matrix language such as the SAS Interactive Matrix Language (SAS/IML). This article shows how to implement three-dimensional rotation matrices and use them to rotate a 3-D point cloud. Define
Elections in the US are a 'target rich environment' for data analysts. There are surveys and forecasts before the election, and the presentation of results during and after the voting. What's your favorite election-related graph of all time? For the current (2016) presidential election, my favorite graphs are on the
The digital age has fundamentally changed how brands and organisations interact with consumers. This shift has been a crucial part of the Third Industrial Revolution and helped spark the era of consumers sharing their data with different organisations. But now organisations are heralding the Fourth Industrial Revolution, and data is
My river walk last week turned into a spectacular fall show. But if it rains this week in San Antonio, like the weatherman predicts, what will I do? In the coming days, I’ll be presenting at two user groups, one in eastern Canada in Halifax, and the other all the
Electronic health records (EHRs) and the overall advancement of information technology have produced a tsunami of data that must be stored, managed and used. Some had naively hoped that EHRs would bring a simpler, more streamlined industry. Instead, we’re finding that the delivery and management of health care is more
Being an Eagle Scout, the data for good movement caught my attention. I wondered if I could apply my computer skills in a way that might help. How about showing people better ways to visualize HIV/AIDS data - that might help doctors better understand the data, and therefore better treat
Occasionally on a discussion forum, a statistical programmer will ask a question like the following: I am trying to fit a parametric distribution to my data. The sample has a long tail, so I have tried the lognormal, Weibull, and gamma distributions, but nothing seems to fit. Please help!! In