Scale a density curve to match a histogram

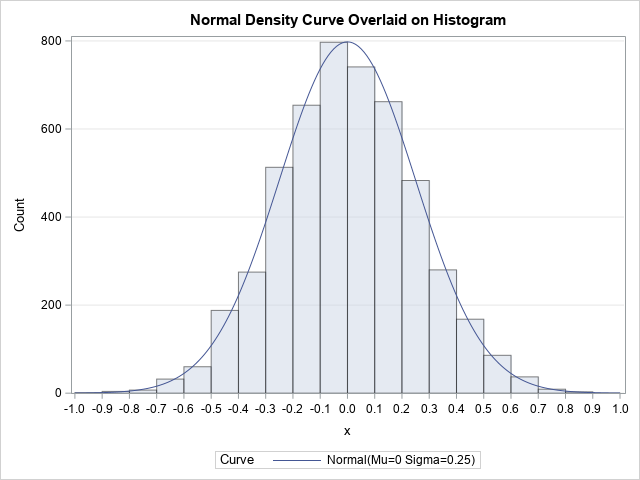
This article discusses how to scale a probability density curve so that it fits appropriately on a histogram, as shown in the graph to the right. By definition, a probability density curve is scaled so that the area under the curve equals 1. However, a histogram might show counts or