Order variables by using a loading plot

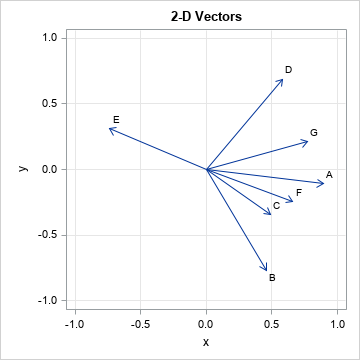
The article "Order two-dimensional vectors by using angles" shows how to re-order a set of 2-D vectors by their angles. Because angles are on a circle, which has no beginning and no end, you must specify which vector will appear first in the list. The previous article finds the largest