All Posts

Even if you cannot attend SAS Global Forum next week, you can experience it virtually via the Livestream sessions. This year I will reprise my role as host of SAS Tech Talks, a pair of live webcasts that feature SAS R&D professionals and their latest technological wares. Click "play" on


True to its central theme "Strength in Numbers", SAS Global Forum 2013 is opening conference doors even wider this year and welcoming the SAS community to participate wherever you are. So sit back and enjoy the show!

The 2013 SAS Global Forum is around the corner in San Francisco and the anticipation is building. Early indications are that attendee registration is up from last year, and we are looking forward to a great conference starting Sunday, April 28. It is great to see the large and diverse offering


I’ve attended many trade shows and conferences in my career, but there is nothing like a user conference. I feel that way because I’ve been working with SAS and DataFlux users for over eight years. Or maybe it’s because I helped plan the DataFlux users event again and again. Nonetheless,


If you're a SAS administrator and haven't registered or planned your agenda for SAS Global Forum 2013, here are a few key happenings to tempt you!
In the SAS User Groups LinkedIn group, some generous "old timers" offer tips to the potentially shy newcomers for connecting with other SAS professionals at SAS Global Forum. Perhaps these folks remember their own introverted natures, and they want to encourage attendees to get the most out of their conference

The conference is less than a month away and I am excited to travel to SAS Global Forum. It seems like just yesterday when I accepted the responsibility of being the conference chair, I was full of ideas and aspirations for what I envisioned at this conference. Fortunately, all these

Well really, the gumption, you’re probably thinking—sharing tips with seasoned SAS Global Forum participants! I’m excited beyond measure, thrilled and a little nervous to be presenting in San Francisco. Yes, I know I’m a Global Forum first-timer, but with your permission, I’d like to offer some tips that I've found


Welcome to Part 3 of the value-added Myth Busters blog series. I have heard a variation of this many times. “Why shouldn’t educators just use a simple gains approach or a pre- and post-test? They can trust simpler methodologies because they can replicate and understand them more easily.” Simple growth measures


Continuing with our stringed list theme, in this post I would like to talk about applying functions to those lists. So far we have developed quite a few tools that can manipulate lists in different ways, but what good are they if we can’t do something meaningful with the lists?
In the previous two articles we discussed Discrete Attribute Maps, and how these can be used to ensure that group attributes like color are consistently mapped to group values regardless of their position in the data. Now, let us take a look at the attributes map that allows you to
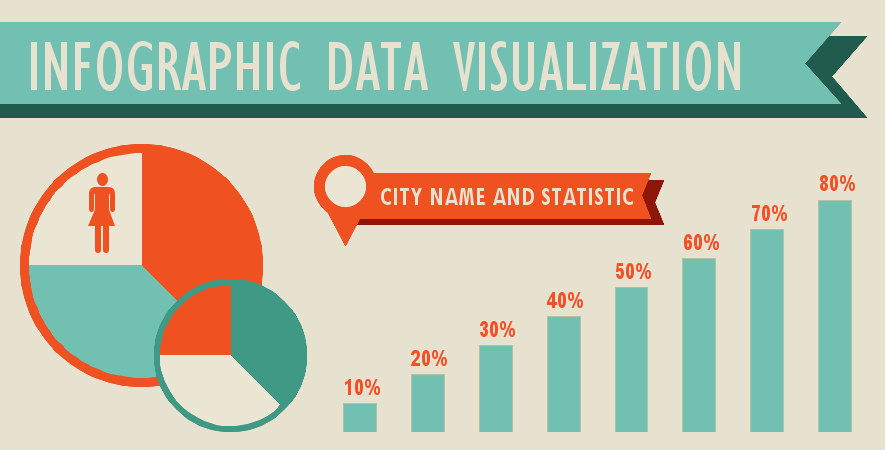

I haven't seen an official definition of 'infographic' that I really like ... but in my mind it's something 1/2 way between data visualization & artwork. It borrows elements from graphs & dashboards, and combines that with an artistic poster. If you perform a Google image search on infographic you'll see

As a SAS consultant, trainer and regular presenter at local user groups, I (think I'm) fairly comfortable presenting to SAS users, managers, stakeholders and others of varying numbers. Following on from Tricia Aanderud's Presentation Horror Storiesd I'm reminded why this is one of my favorite tips: Know your audience.

I have been on both sides of the table during an interview to hire a SAS administrator. I’ve been hired as a SAS administrator, and I have hired SAS administrators. Today, I work with SAS customers to help them find the best software for their business needs. I get asked-


Peppers, sweet or hot, are packed full of great nutrition and are extremely versatile ingredients. Bell peppers are a favorite pepper for many and appeal to a wide range of people because, while they still have a bite, they are much sweeter since they lack capsaicin (compound responsible for the