All Posts


One of our readers asked if we could explain some of the thinking behind SAS’ recent decision to modify its support for US regional users groups. Over the past five to ten years, users have been telling SAS they need more targeted, more local and more immediate types of support, especially technical

SAS Data Management is a popular topic here on the SAS interwebs. You can find all types of information ranging from thought leadership to white papers to product details. At SAS Global Forum I sat down with Nancy Rausch, one of the principal R&D managers behind the SAS Data Management
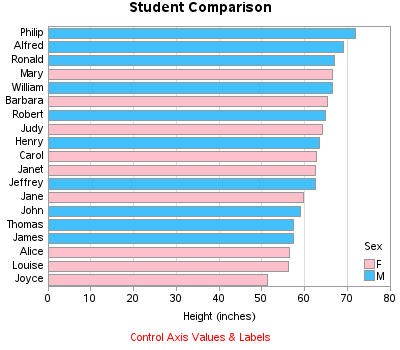

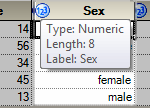
Do you know how to create a bar chart using SAS, and when to use what kind of bar chart?!? If the answer doesn't come to you "easy as pie" then this blog is for you! Below are several examples of different kinds of bar charts you can create with SAS/GRAPH.


Please register and join SAS Product Manager Amy Peters on September 26 at 1:00 pm ET for a SAS Talks webinar: SAS 9.4: What's New for SAS Administrators. This SAS Talks webinar is laser-focused on enhancements and changes that will interest SAS administrators. Specifically, Amy will highlight how the new


Another summer has almost come and gone and fall is on its way bringing cooler temperatures, lower humidity, and colorful leaves. However, just because fall is knocking on our door doesn’t mean we have to stop enjoying our favorite summer produce. If you’re a home gardener or a frequent flyer

Creating bar charts with group classification is very easy using the SG procedures. When using a group variable, the group values for each category are stacked by default. Using the sashelp.prdsale data set and default STAT of SUM, here is the graph and the code. SGPLOT code: proc sgplot data=sashelp.prdsale;
It's been almost 5 years since I posted one of the first custom tasks for SAS Enterprise Guide. It was a task that made it easier to convert SPSS data files into SAS data sets. Like many projects that begin as custom tasks, this one later became a feature in
Some handy folks at SAS got together and created a series of videos to help you get started with the SAS 9.4 installation. It starts with the basics that explain what you should do with your Software Order Email. Step two provides videos for creating or moving the software depot.

I am passionate about teaching. My colleagues would probably say this is the understatement of the year. And it likely has something to do with the fact that both of my parents were teachers. I started my teaching career at the university level and after many years an unexpected opportunity


SASuser power! Does this phrase conjure up any images for you? I visualize SAS users across the globe, addressing messy data, combating fraud, and making use of business analytics to provide insight and add business value for organizations around the world. We, SASusers are powerful! With the Potential of One


Sometimes it is useful in the SAS/IML language to convert a character string into a vector of one-character values. For example, you might want to count the frequency distribution of characters, which is easy when each character is an element of a vector. The question of how to convert a
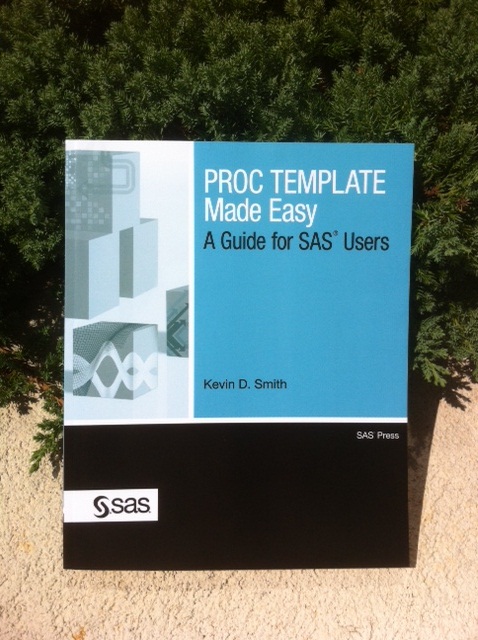

This week's SAS tip is from Kevin D. Smith and his new book PROC TEMPLATE Made Easy: A Guide for SAS Users. Kevin is a software developer at SAS with extensive experience supporting PROC TEMPLATE and underlying ODS technologies. We're excited that Kevin decided to write his book and hope

Fall is rolling around, which means time to plan and attend at least SAS regional conferences. I’m heading to the Southeastern SAS User’s Group (SESUG) conference in beautiful St. Petersburg, Florida. While I do love the conference, they had me at St. Pete Beach!
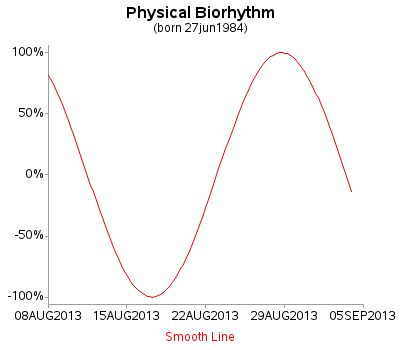
Do you know (right off the top of your head) the simple SAS/GRAPH code you would use to create line graphs? ... If not, then this tutorial is for you! A line plot is basically a scatter plot where the markers are connected. A line plot should only be used

With the popularity of SAS Grid Manager, this question often comes up: which clustered or shared file system should we use with the multiple nodes of the SAS Grid? This is a question that needs to be thought through very carefully because the amount of time and effort to fix