All Posts

Congratulations to Best Paper Winners from MidWest SAS Users Group conference! You'll want to read these, and check the MWSUG 2013 proceedings for other useful papers from the recent conference. Start planning now for MWSUG 2014 in Chicago.


Recently I delivered a SAS Talks session: SAS 9.4: What’s New for SAS® Administrators . We had a large group attend and subsequently had a wonderful flood of questions that we couldn’t always keep up with. So I wanted to follow up with some of the popular questions:


The herbs and spices we use to flavor our foods can have powerful health benefits. Along with cinnamon and ginger, one of the most potent spices we have in our kitchen is turmeric. Turmeric is a bright yellow spice commonly found in curry powder (typically a mixture of coriander, cumin, fennel, mustard
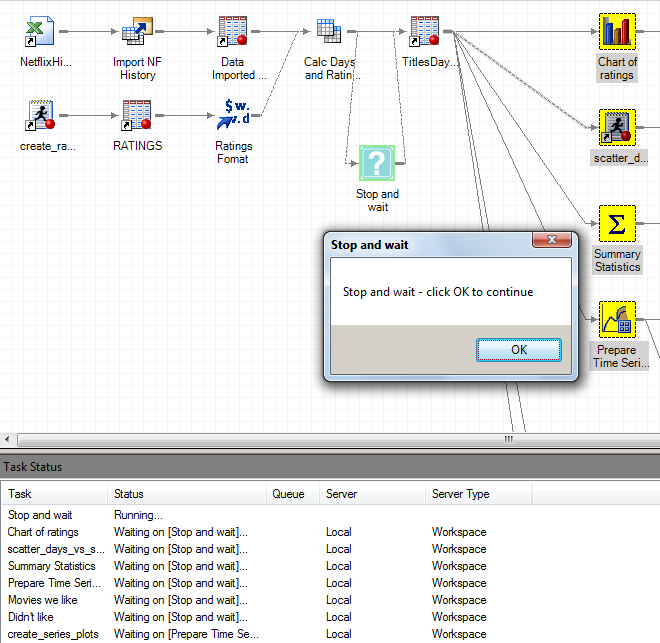

Traditionally, SAS users like their processes to behave like Ron Popeil's famous rotisserie: they want to set it and forget it. That's the definition of a batch process. You work like heck to get it ready to run, then you push the button (or schedule it) and walk away. But

This year, SAS users are flocking to the Western Users of SAS Software’s (WUSS) annual conference. I had a chance to catch up with Operations Chair MaryAnne DePesquo, and she shared her excitement about this year’s conference. This is the first year that WUSS will be hosted in Las Vegas


Energetic. Content Rich. Powerful. That's how I describe the upcoming conference. We have a great presentation lineup and new opportunities for you to take advantage of. Register now and reserve your seat today! Here are a few of our confirmed speakers: A two-time winner of the USA Memory Championship, Nelson


What is the best way to share SAS/IML functions with your colleagues? Give them the source code? Create a function library that they can use? This article describes three techniques that make your SAS/IML functions accessible to others. As background, remember that you can define new functions and subroutines in

San Antonio plays host to this year’s South Central SAS Users Group (SCSUG) Educational Forum. Instead of the usual Sunday to Tuesday schedule, this year’s forum is being held on a Thursday (Oct. 31) and Friday (Nov. 1). But don’t worry – Halloween costumes aren’t being encouraged – the focus
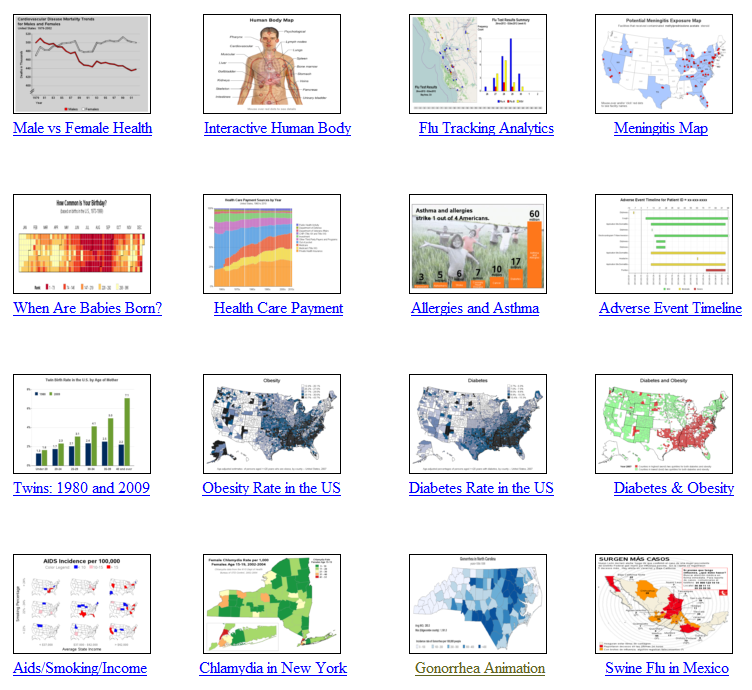

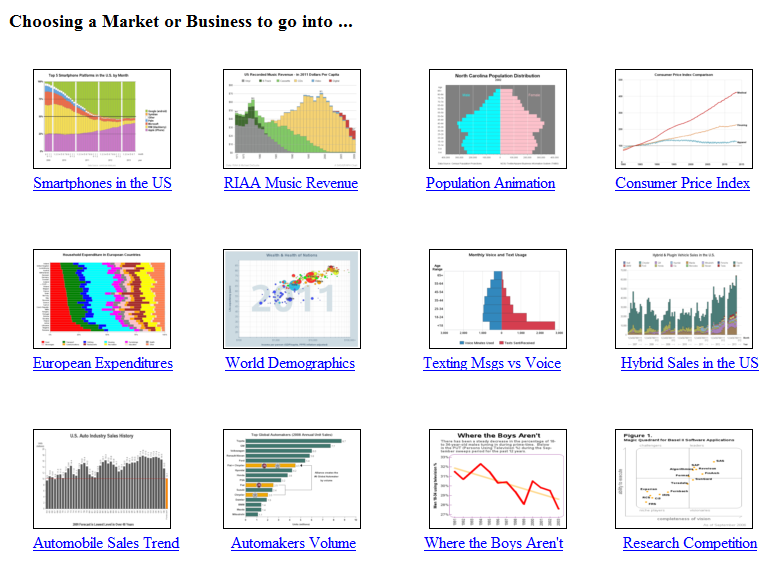
"It slices, it dices ... it helps test laboratory mices!" In a joking way, this is a perfect description of SAS software, don't you think!?! :) And to prove it, this blog contains a collection of 32 examples, showing a variety of ways SAS can be used to graph data
Do your SAS programs read extra-large volumes of data? Do they run multiple DATA steps and procedures one after the other for hours at a time? Two papers from MWSUG 2013 show how you can speed up those long-running SAS jobs. Although their approaches and environments differed, both authors made
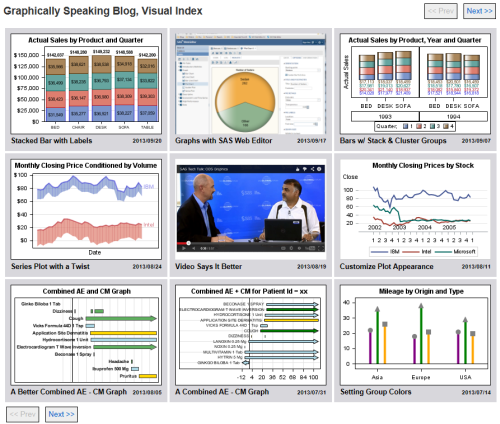

Some of you may have already noticed the small graphical icon on the lower right side of the blog article labeled "Graphically Speaking Index". Yes, it is a link to a visual index for all articles published in this blog. Well, eventually it will have all the articles. So far, I

Has this ever happened to you? You have a SAS program with statements that you wrote, then you make use of a macro function or %include file supplied by a helpful colleague, and when your SAS code resumes, you find that all of your SAS titles have been changed out
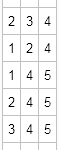
Last week I described how to generate permutations in SAS. A related concept is the "combination." In probability and statistics, a combination is a subset of k items chosen from a set that contains N items. Order does not matter, so although the ordered triplets (B, A, C) and (C,

Some recent press articles question the value of big data while a book takes the opposite approach; I’ll choose the middle way. The New York Times article ‘Is Big Data an Economic Big Dud?’ questions the value of digital data and the resulting increase in the amount of data. This
"It's a floor wax, and a dessert topping" - this pretty much describes SAS/Graph! (bonus points if you know where this quote came from!) Some people think of SAS as just a quality control tool. Others think of it as just a sales & marketing tool. And yet others think