All Posts

If breakfast truly is the most important meal of the day then why do so many of us skip it? Often it’s because we feel we don’t have enough time or we just aren’t hungry. However, taking a few quick minutes in the morning to "break the fast" can have


This is the last post in my recent series of articles on computing contours in SAS. Last month a SAS customer asked how to compute the contours of the bivariate normal cumulative distribution function (CDF). Answering that question in a single blog post would have resulted in a long article,

Although she’s an analyst, Anca Tilea estimates that she spends 80% of her time cleaning data. Tilea and co-author Deanna Chyn shared seven of their favorite methods for checking, cleaning and restructuring data. Attendees at MWSUG 2013 got a bonus tip: Ask SAS peers in one of the SAS Support

I’m here at MWSUG 2013 soaking up the regional experience. After spending a couple of days in Columbus, I’m seeing first-hand how much users care about working with SAS software and about being part of the SAS community. It’s been a great conference so far—-presentations are packed! Walking through the


When we announced the SAS Global Forum 2013 Best Contributed Paper winners on our blog, the response was huge! I asked the authors to comment on whether or not their paper topics had any broader applications. The response was overwhelmingly positive. Seems like these winning SAS findings are Swiss army
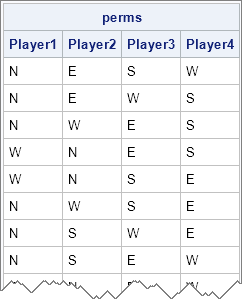
I've written several articles that show how to generate permutations in SAS. In the SAS DATA step, you can use the ALLPEM subroutine to generate all permutations of a DATA step array that contain a small number (18 or fewer) elements. In addition, the PLAN procedure enables you to generate
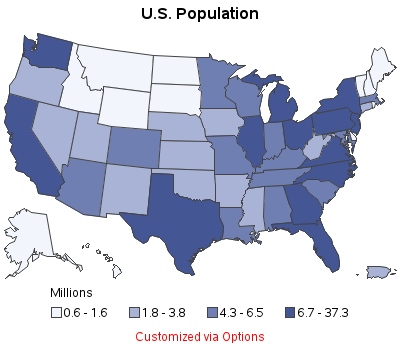

Your biggest problem with maps used to be learning how to fold a paper road map. Today, with the advent of GPS, Google Maps, and location-specific data, the bar has been raised! ... you now need to know how to plot your data on a map! Below are several examples of different kinds

A couple of weeks back we had a question on how to make a bar chart with stacked and clustered groups. User also wanted to display the value for each stacked segment below the bars. The article Bar Charts with Stacked and Cluster Groups shows how to create such a
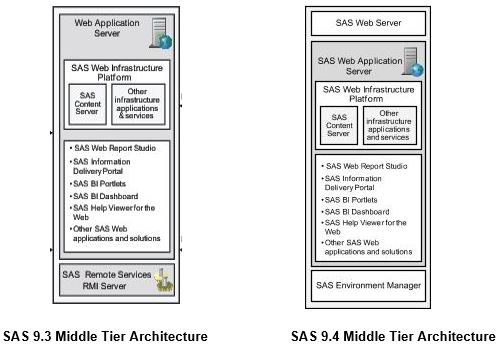
My family are all Lord of the Rings Trilogy fans. As a novice in the world of SAS administration, I find discussing the SAS middle tier architecture a little like traveling through Middle Earth. For me, it’s new and fascinating terrain. And like other travelers, I would find it useful


Sometimes, your first impulse may not be correct, like trading in your practical sedan for a hot 2-seater. Other times, your first impulse is perfect, as in the examples below. Suppose the automobile data you wish to analyze resides in a CSV file. Naturally, your first impulse is to import
Recently, SAS released SAS Solutions OnDemand for academics. An academic user who is signed up for this can use the SAS Web Editor application to do all their data analysis over the web using a hosted server at SAS. This frees up the user from having to install the software on their own computers,


A couple of years ago I shared a method for copying any file within a SAS program. It was a simple approach, copying the file byte-by-byte from one fileref (SAS file reference) to another. My colleague Bruno Müller, a SAS trainer in Switzerland, has since provided a much more robust
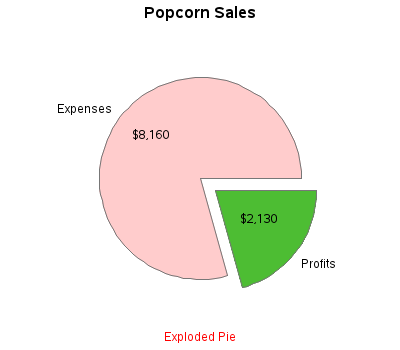
There's an old expression "easy as pie." Have you ever tried to bake a pie??? ... It's not so easy, LOL! And neither is using pie charts correctly! :) Below are several examples of different kinds of pie charts you can create with SAS/GRAPH. And at the bottom of this
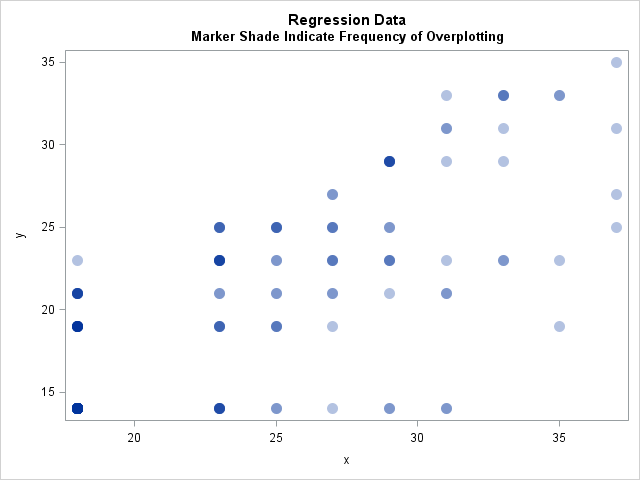
This week I read an interesting blog post that led to a discussion about specifying the frequencies of observations in a regression model. In SAS software, many of the analysis procedures contain a FREQ statement for specifying frequencies and a WEIGHT statement for specifying weights in a weighted regression. Theis


Like many of you teachers out there, I spent a lot of time recently preparing for the new school year. At home, it began with the therapeutic organization of children's rooms. As I sat amid in outgrown clothes, last year’s school work, and books to donate, I braced myself and