All Posts

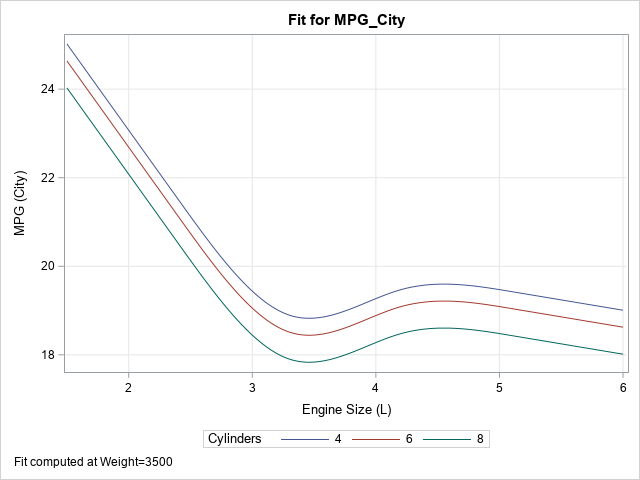
A SAS analyst read my previous article about visualizing the predicted values for a regression model that uses spline effects. Because the original explanatory variable does not appear in the model, the analyst had several questions: How do you score the model on new data? The previous example has only

The new SAS Certified Specialist: Statistics for Machine Learning credential is designed to help you showcase your expertise and commitment to staying ahead in the industry.

생성형 AI는 우리의 업무 환경과 사회를 변화시키고 있습니다. 사람과 기술이 상호작용할 새로운 방법을 제시하며 상상을 능가하는 속도로 영향을 끼치고 있죠. 최근 실시한 조사 결과는 생성형 AI에 대한 흥미로운 시각을 제시하고 있는데요, 기업 의사결정자들이 체감하는 생성형 AI의 해결 과제와 기회를 동시에 확인하실 수 있습니다. 대다수의 응답자는 GenAI를 통해 직원 만족도가 향상되었고(82%),

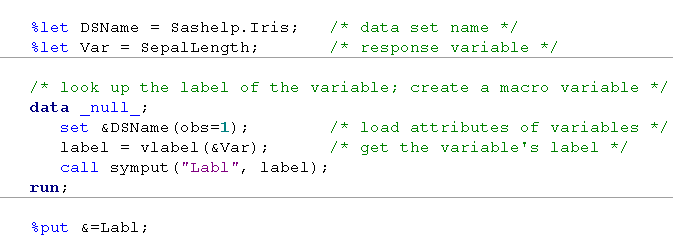
Sometimes labels for variables get "dropped" during data preparation and cleaning. One example is when data are transposed from "wide form" to "long form." For example, suppose a data set has three variables, X, Y, and Z, each with labels. If you transpose the data to long form, the new

Una encuesta mundial de profesionales antifraude realizada por la ACFE y SAS revela un increíble entusiasmo por la IA generativa, pero estudios de referencia anteriores sugieren una realidad más difícil. La IA generativa ha cautivado la imaginación del público, y su poder y promesa parecen estar a punto de afectar

Batch manufacturing involves producing goods in batches rather than in a continuous stream. This approach is common in industries such as pharmaceuticals, chemicals, and materials processing, where precise control over the production process is essential to ensure product quality and consistency. One critical aspect of batch manufacturing is the need to manage and understand inherent time delays that occur at various stages of the process.

Remember when the popular catchphrase, “We have an app for that,” was the new big thing? You might not if you’re as young as the NC State University students who recently participated in the 11th annual SAS-NC State Design Project, but back when we could still count 21st-century years in

Skeletal muscle is important for so many reasons beyond movement or aesthetics. Muscle is a vital part of our metabolic and overall health, playing a key role in how we control glucose, insulin, energy levels and longevity.

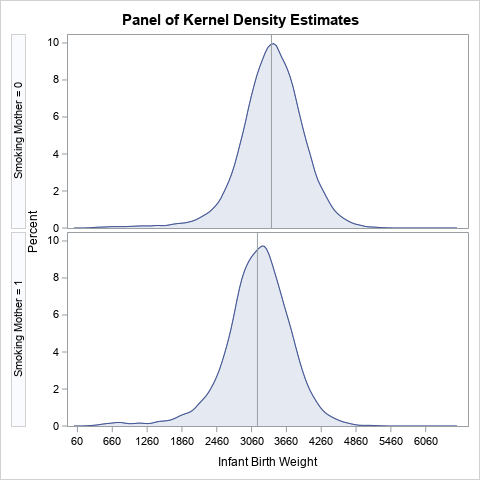
A SAS programmer wanted to visualize density estimate for some univariate data. The data had several groups, so he wanted to create a panel of density estimate, which you can easily do by using PROC SGPANEL in SAS. However, the programmer's boss wanted to see filled density estimates, such as

Generative AI (GenAI) is in its most popular era and many organisations across industry are looking for ways to unlock its potential value. McKinsey's projections suggest that GenAI could add a staggering $2.6 to $4.4 trillion in value to the global economy. In fact, banking is the number one industry

Across the world, investigators and law enforcement officers are tackling a rapidly evolving and expanding workload fueled by an increase in complex modern-day crimes. As technology alters the type and methodology of the crime itself – the evasion of tax payments, theft of public funds, erroneous disbursement of benefits, gaming

Our employees’ health and well-being is important to us, so we make sure that they – and their families – have access to facilities and programs promoting fitness, wellness and recreation. That’s why our headquarters campus has 28 acres dedicated to the physical fitness of employees (and that doesn’t include

After writing a program that simulates data, it is important to check that the statistical properties of the simulated (synthetic) data match the properties of the model. As a first step, you can generate a large random sample from the model distribution and compare the sample statistics to the expected

Imagine stuffing a 500,000-square-foot event space into a 5,000-square-foot hallway. That was the crazy idea I had when I checked out the Innovation Hub. The Innovation Hub was the center of the action at SAS Innovate in Las Vegas. Attendees saw demos of the hottest new SAS solutions, met the technical

桜が散ったと思うと、いつの間にかツツジの季節がやってきた。ツツジは、4月中旬から5月中旬にかけて咲く、日本で最も親しまれている植物の一つであり、桜の散る頃から北海道から沖縄まで全国各地の様々な場所で楽しめる花でもある。歴史的には、徳川家のツツジ好きもあって江戸幕府が植栽に力を入れ、大名たちの間で庭園づくりブームが起きたとか。 さて、統計学のコースだが、多くの良質な書籍やコンテンツがあり、感心するものも多いが、しかし、入門としては物足りなさを否めない。特に、「社会人のための・・・」をうたったコースにおいては、統計学を長年体系的に勉強した者として、大学(統計学部)の授業のようなものが多く一般人にはレベルが高い印象を受ける。また、日本独自の事情やニーズに合った教材が必要ではないかと思う。 前述したツツジのように統計学が日本中に広まってほしい、データリテラシーの底上げに貢献したいという気持ちから、「統計学入門」コースを新設した。このコースは、統計の勉強をしたことがない社会人向けに分かりやすく統計の基礎を解説し、かつ実務へのつながりを意識した質問、例を盛り込むことで、統計学の概念の定着につながるように構成している。実務に統計学がどのように活用されているのかなどをより意識したコース内容となっている。また、本コースはSAS製品を使用していない方でも受講可能である。この機会にぜひ受講を検討いただきたい。 2024年5月初旬 相吉


