All Posts


Unless you live in England, you may not have seen the recent announcement that Buckingham Palace is to undergo a 10-year refurbishment costing the British taxpayer £369M. Even with the post-Brexit devaluation of Sterling, that’s still a sizable spend representing nearly US$500 million. The Queen will remain in residence during


Thank you SAS community for all the fun this year! We truly enjoy each moment with you as you take care of your health both here at SAS and in your adventures around the world! May you be happy, healthy, and loved now and always! While we're talking health.... Don’t
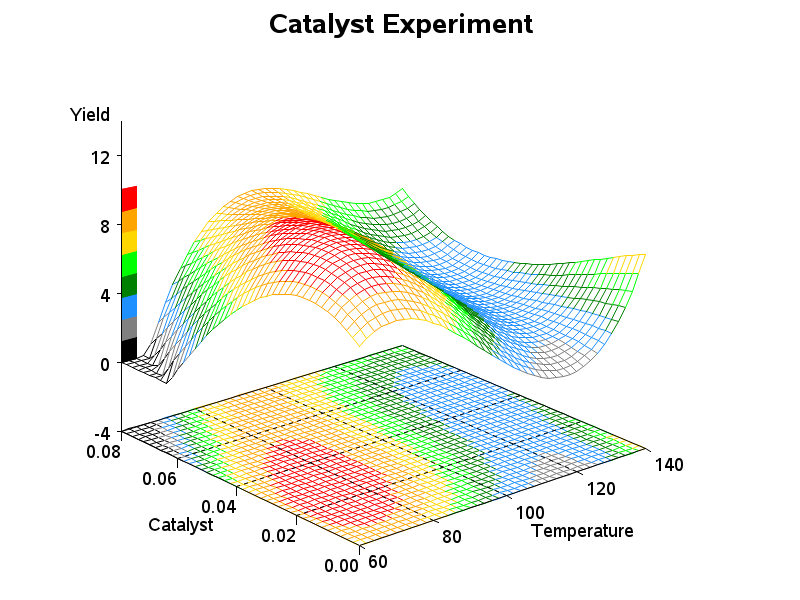

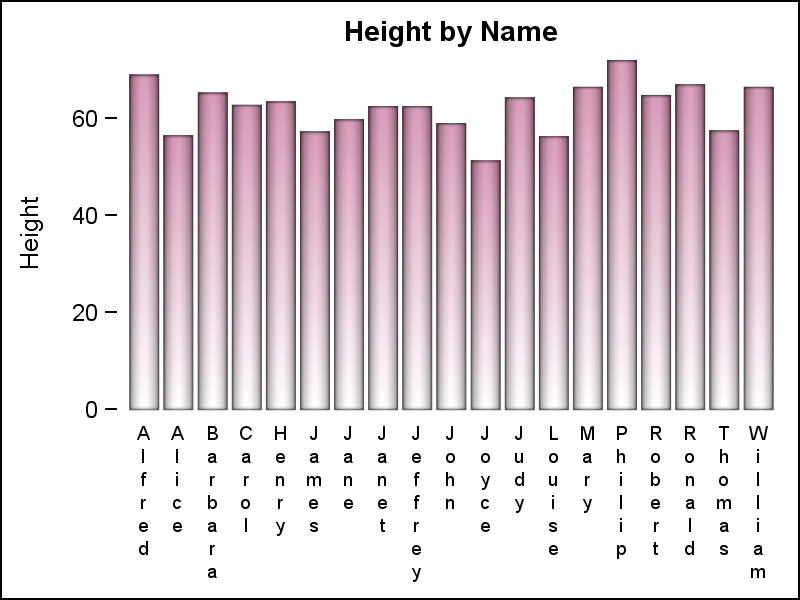
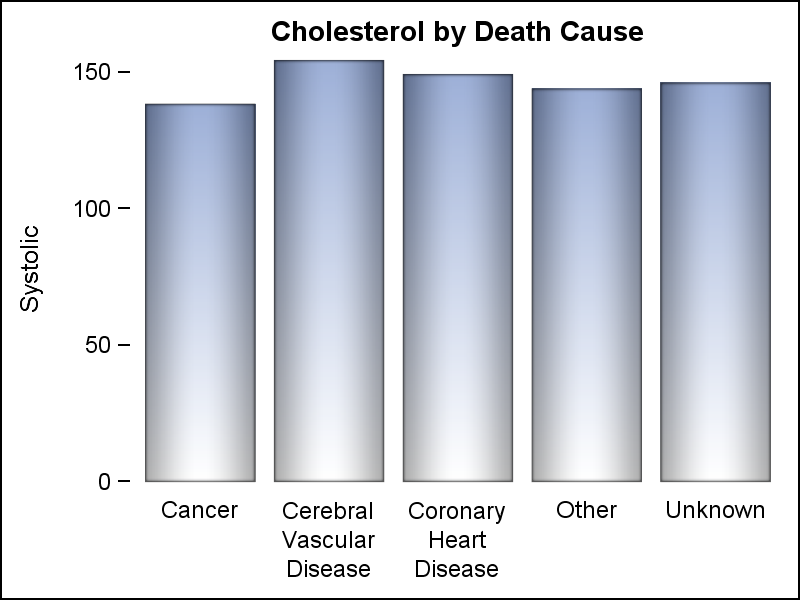
Are you a visualization & graphing expert? Can you identify which tool (R, Excel, Tableau, SPSS, Matlab, JS, Python, or SAS) was used to create each of these graphs? No cheating! I recently read Tim Matteson's blog where he presented 18 graphs, and had his readers try to guess which


I find I am so busy these days, I do all of my holiday shopping online. I set aside an hour, a glass of wine and my credit card, and I get the gifts ordered. The must-have gift for this year was a Dyson hair dryer. When the first site

As states build systems to evaluate the effectiveness of educator preparation programs, they must first know what “effectiveness” looks like. Are the characteristics of the candidates in the program, such as high school GPA, ACT or SAT score, or other admissions criteria, the most important indicators? What about the curriculum

Yesterday, I published an article on Axis values display, where I mentioned the desire expressed by many users to get x-axis tick values in Hotel text orienttion. The name comes from the way many hotel signs are displayed as shown on the right. Such arrangement of text can also be very


As I discussed in the first two blogs of this series, metadata is useful in a variety of ways. Its importance starts at the source system, and continues through the data movement and transformation processes and into operations. Operational metadata, in particular, gives us information about the execution and completion


Anteriormente, el sector empresarial se enfrentaba constantemente a la escases de información de aquello que ocurría en su compañía, tanto a nivel de procesos internos como de interacción con los clientes, siendo este último punto el más relevante por estar ligado la fidelización o desencanto de la marca. Sin embargo,


The title of this post borrows from Stanley Kubrick’s 1964 comedy “Dr. Strangelove or: How I Learned to Stop Worrying and Love the Bomb.” It stars the great Peter Sellers as the titular character as well as George C. Scott and Slim Pickens. The black and white film is strange


Data governance seems to be the hottest topic at data-related conferences this year, and the question I get asked most often is, “where do we start?” Followed closely by how do we do it, what skills do we need, how do we convince the rest of the organisation to get


There has been a lot of speculation over the years about the quality of the optimization solvers in SAS/OR, in particular the mixed integer linear optimization (MILP) solver. Measuring the performance of optimization solvers and comparing different solvers on a test set is a crucial part of modern optimization solver development.


Let me make this clear right from the start: I needed to answer 44 of the 62 exam questions correctly to earn my BASE SAS Programmer certification, and I got exactly 44 right. No margin of error. I never thought I’d be proud of a 70%, but I’m more than
Displaying nicely rendered axis values reduces clutter and makes the graph more readable. With SAS 9.4, we added the ability for splitting x-axis tick values on white space to create a nice and readable x-axis as shown in the graph on the right. It is always a challenge to fit
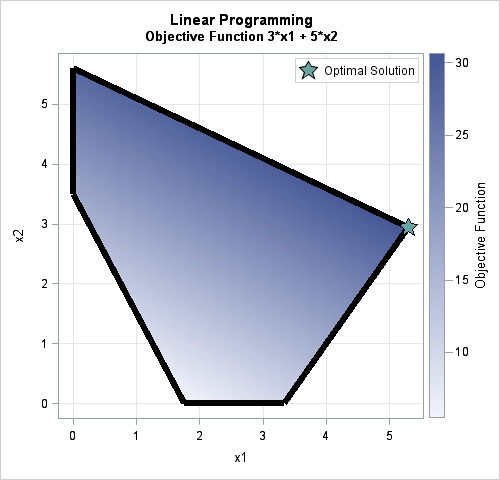

In some applications, you need to optimize a linear objective function of many variables, subject to linear constraints. Solving this problem is called linear programming or linear optimization. This article shows two ways to solve linear programming problems in SAS: You can use the OPTMODEL procedure in SAS/OR software or
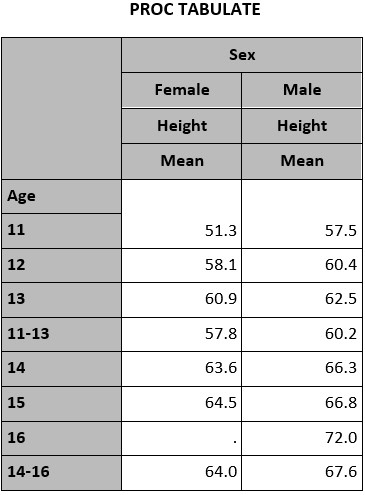

A multilabel format enables you to assign multiple labels to a value or a range of values. The capability to add multilabel formats was added to the FORMAT procedure in SAS® 8.2. You assign multiple labels by specifying the MULTILABEL option in the VALUE statement of PROC FORMAT. For example,