All Posts
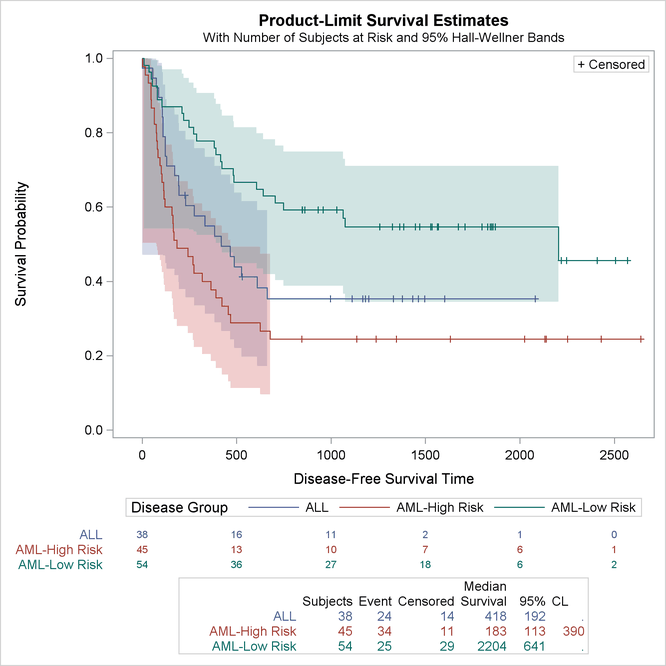

Customizing the Kaplan-Meier plot in assorted ways is so popular that we devote an entire chapter to it in the SAS/STAT documentation.
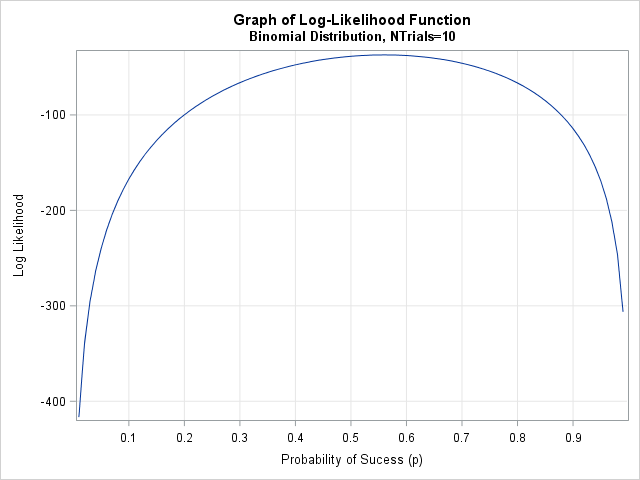

Maximum likelihood estimation (MLE) is a powerful statistical technique that uses optimization techniques to fit parametric models. The technique finds the parameters that are "most likely" to have produced the observed data. SAS provides many tools for nonlinear optimization, so often the hardest part of maximum likelihood is writing down
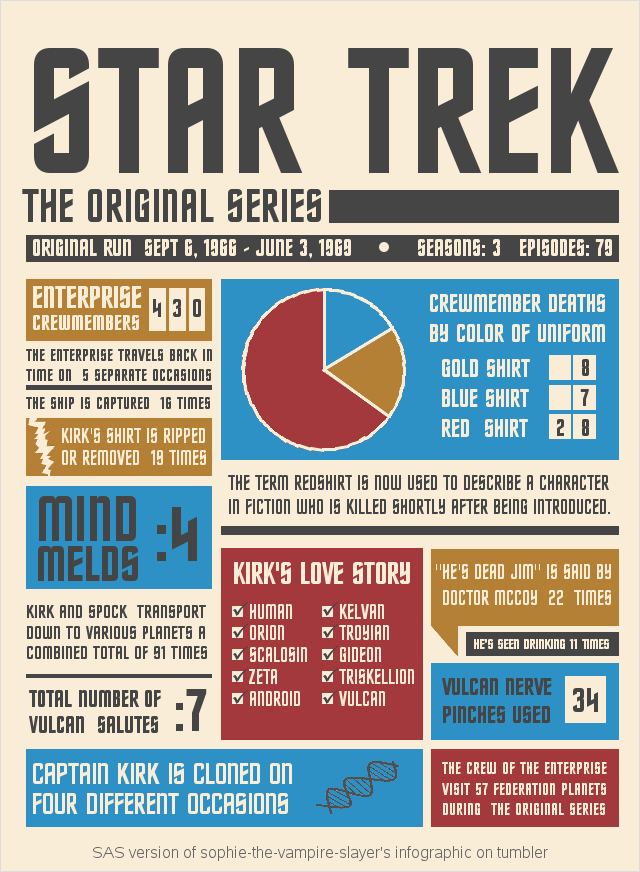

If you were a fan of the original Star Trek television series, you probably remember lots of little details about the show. And you might even feel sorry for the people who don't get the clever references you make to things from the show. If you're that person, then you'll


5月23日に開催されたSAS Forum Japan 2017の「SAS Viyaディープダイブ」セッションでは、SASのAIに搭載されている画像処理機能が入門レベルとして紹介されました。 セッション内では、皆様にとってもお馴染みの「浅草雷門」の写真を使った画像マッチングのデモも紹介しました。雷門を正面から撮った写真の中から、「雷門の提灯」の部分を切り出し、これをテンプレート画像として使用し、この「雷門の提灯」が写っている写真だけを画像マッチングによって見つけ出すというデモです。 さあ、ちゃんと「雷門の提灯」が写っている写真だけを見つけ出すことができたのでしょうか? 以下は、Jupyter Notebookを使用し、PythonからSAS の画像処理機能を活用してマッチングを実行した結果です。(コードの一部抜粋) 【ライブラリのインポート】 In [16]: # import libraries import swat import matplotlib.pyplot as plt import os import json import numpy as np 【テンプレート画像「雷門の提灯」のロード】 In [24]: # load an image to cas r = conn.image.loadImages(casout={"caslib":"casuser", 'name':tmp_file_data[0], 'replace':True}, path=tmp_file_path) tmpTable = conn.CASTable(tmp_file_data[0]) 【この画像にマッチングさせます】 【マッチング対象画像のロード】


Ahora más que nunca, las personas quieren explorar los datos de su organización y utilizar la analítica, incluso si no poseen habilidades analíticas avanzadas. Al mismo tiempo, el personal de TI tiene más dificultades para satisfacer las constantes demandas de acceso y preparación de datos, además de gestionar las solicitudes
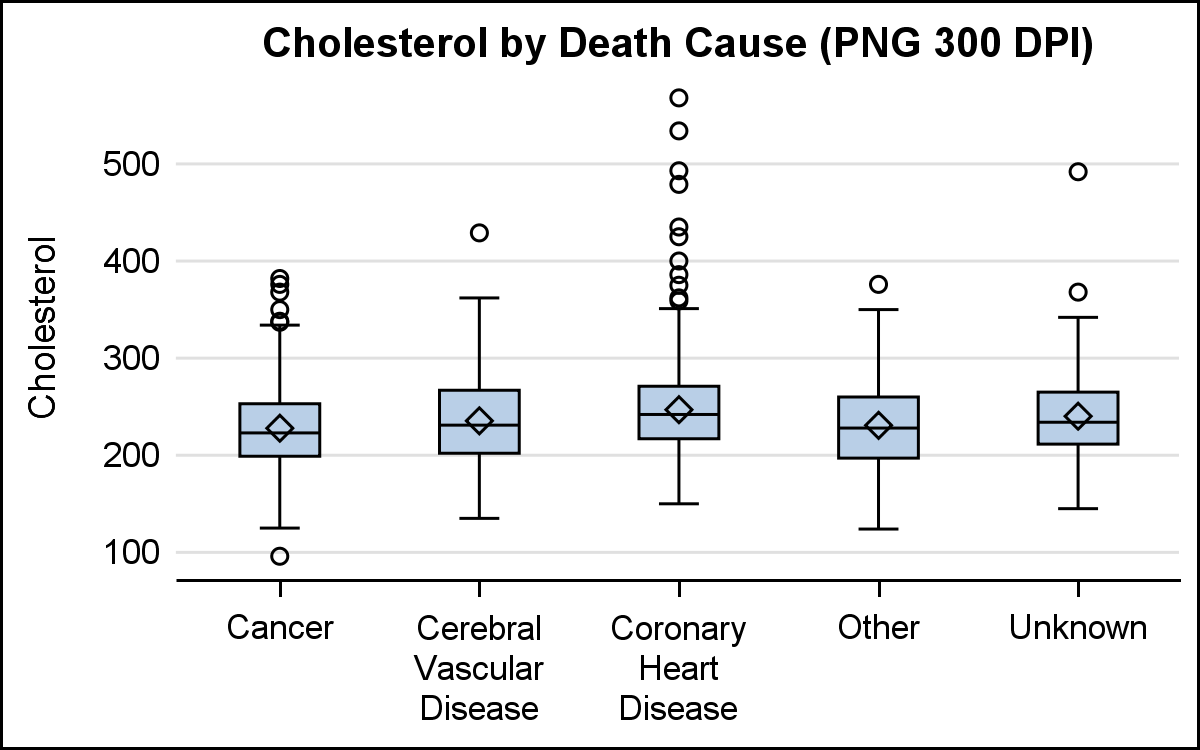

On a recent trip I met a long time user and early adopter of ODS Graphics who started using GTL with SAS 9.1.3, even before it was released as production with SAS 9.2. This user has presented many papers at SGF on GTL and some hands-on sessions on ODS Graphics Designer.


“Dejar de pensar en el pasado y empezar a crear el futuro es la base de toda transformación”. - Jim Goodnight No es casualidad que este mensaje que alimenta el espíritu de transformación y digitalización de los negocios en la actualidad sea también el de la analítica, esa ciencia que SAS


Utilities can save as much as $10 million a year for every one percent improvement in forecast accuracy by optimizing asset utilization and trading strategies. Changing energy markets and an influx of data from the smart grid are providing more opportunities to reap value from energy forecasting. Improving energy forecasts
"How'd you lose the weight?" It was not a magic pill, special diet, or a shot from the doctor - wouldn't that have been nice? How did I lose my baby weight? I finally got back to what I've been telling folks to do most of my life: eat right


Todd Wright says addressing GDPR compliance might be just the catalyst the insurance industry needs.


In a world that never stands still, especially in the post-Brexit whirlwind the UK will soon be entering, it’s imperative that government is agile and responsive. More importantly, how can this capability be arrived at without breaking the bank? The UK Government recently released its Transformation Strategy 2017 to 2020.
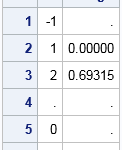
I have previously discussed how to define functions that safely evaluate their arguments and return a missing value if the argument is not in the domain of the function. The canonical example is the LOG function, which is defined only for positive arguments. For example, to evaluate the LOG function


Innovation used to happen in structured cycles. The new invention was often a planned event and the domain of a select few departments within an organisation. But in today's always-on economy enterprises need to innovate on a continuous basis to keep up with new players that base their entire businesses
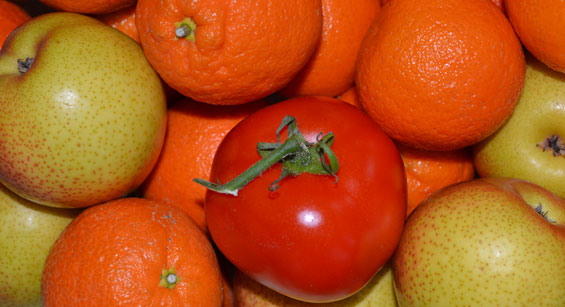

The ancient political maxim “divide and conquer” (Lat. “dīvide et īmpera”) has been used for millennia in politics, sociology, and psychology, mainly to manipulate people. In the last two centuries, however, this principle has also been adopted by computer science. It is widely used in computer programming, primarily in computer
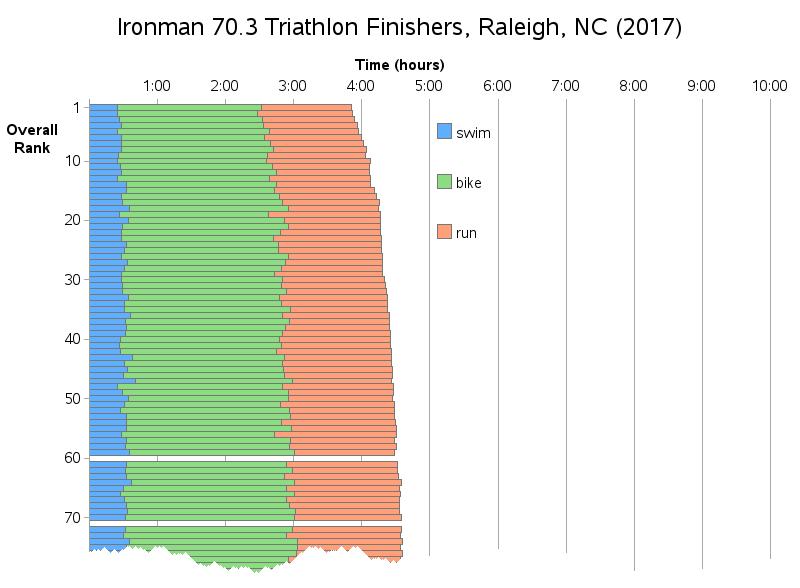
This past weekend, I was a volunteer helping with an Ironman 70.3 race. I was really impressed & inspired by the athletes ... I was also excited about the quantity and variety of data generated by this type of race (compared to a regular marathon). And as a 'graph guy' I