All Posts
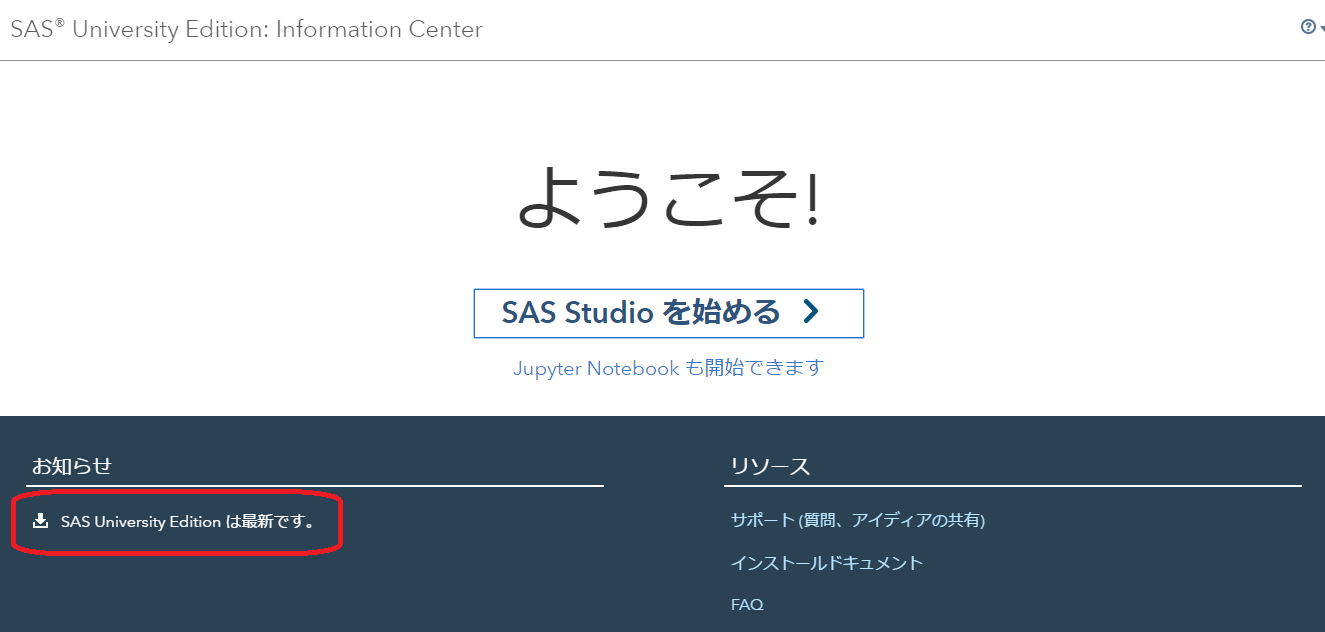

学術研究、教育、および自己学習の目的に無償で利用できる SAS University Edition は、毎年7月末にライセンスの期限が切れます。ライセンス期限の2ヶ月ほど前から、SAS University Edition Information Center にライセンス失効のお知らせと更新の案内が表示されますが、SAS University Edition のインストール時期によって必要な作業が異なりますので、以下に紹介します。 まずは、仮想マシンのSAS University Edition を起動し、表示されたURLから SAS University Edition Information Center にアクセスします。仮想マシンの起動後のウインドウで、URLが記載されている場所は下の画像を参考にしてください。(クリックすると画像が拡大されます。) SAS University Edition Information Center のデザインは、SAS Univeristy Edition のインストールの時期によって異なります。2016年12月以前にインストールした場合は、下の画面が表示されます。 こちらが表示された場合は、下記URLにアクセスし、新たにダウンロードした SAS University Edition を、仮想マシンに再登録する必要があります。 こちらが表示された場合は、左下の「お知らせ」にある「ダウンロード」ボタンから更新作業を行います。これ以降、ブラウザに表示される指示に従ってください。もし、うまく更新できない場合は、ブラウザのCookieを削除してからもう一度更新作業を行ってください。それでも更新できない場合は、上記URLから新たに SAS University Edition をダウンロードし、仮想マシンに再登録してください。 更新作業が完了すると、下の画像のように、SAS University Edition Information Center の「お知らせ」部分に、「SAS University Edition

Summer is here, which means vacations and time at the pool with a good book. If expanding your knowledge is a goal of yours this summer, SAS has a shelf full of new titles becoming available over the next few months. From new editions of classics – such as SAS® for Forecasting

I've found that when supporting others it can be helpful to simply normalize that it's ok to feel two things at once. Usually, one of the two is more "taboo". "Of course you are feeling disappointed by your friend's actions. Being disappointed doesn't mean you are not appreciative of the positive aspects of your friendship." "Of course you


Let me start by posing a question: "Are you forecasting at the edge to anticipate what consumers want or need before they know it?" Not just forecasting based on past demand behavior, but using real-time information as it is streaming in from connected devices on the Internet of Things (IoT).

In a previous blog, I demonstrated a program and macro that could identify all numeric variables set to a specific value, such as 999. This blog discusses an immensely useful technique that allows you to perform an operation on all numeric or all character variables in a SAS data set.


Matthew Magne describes how SAS Data Quality can help you build a trusted data foundation, one stone at a time.
When I teach my Data Cleaning course, the last topic I cover in the two-day course is SAS Integrity Constraints. I find that most of the students, who are usually quite advanced programmers, have never heard of Integrity Constraints (abbreviated ICs). I decided a short discussion on this topic would
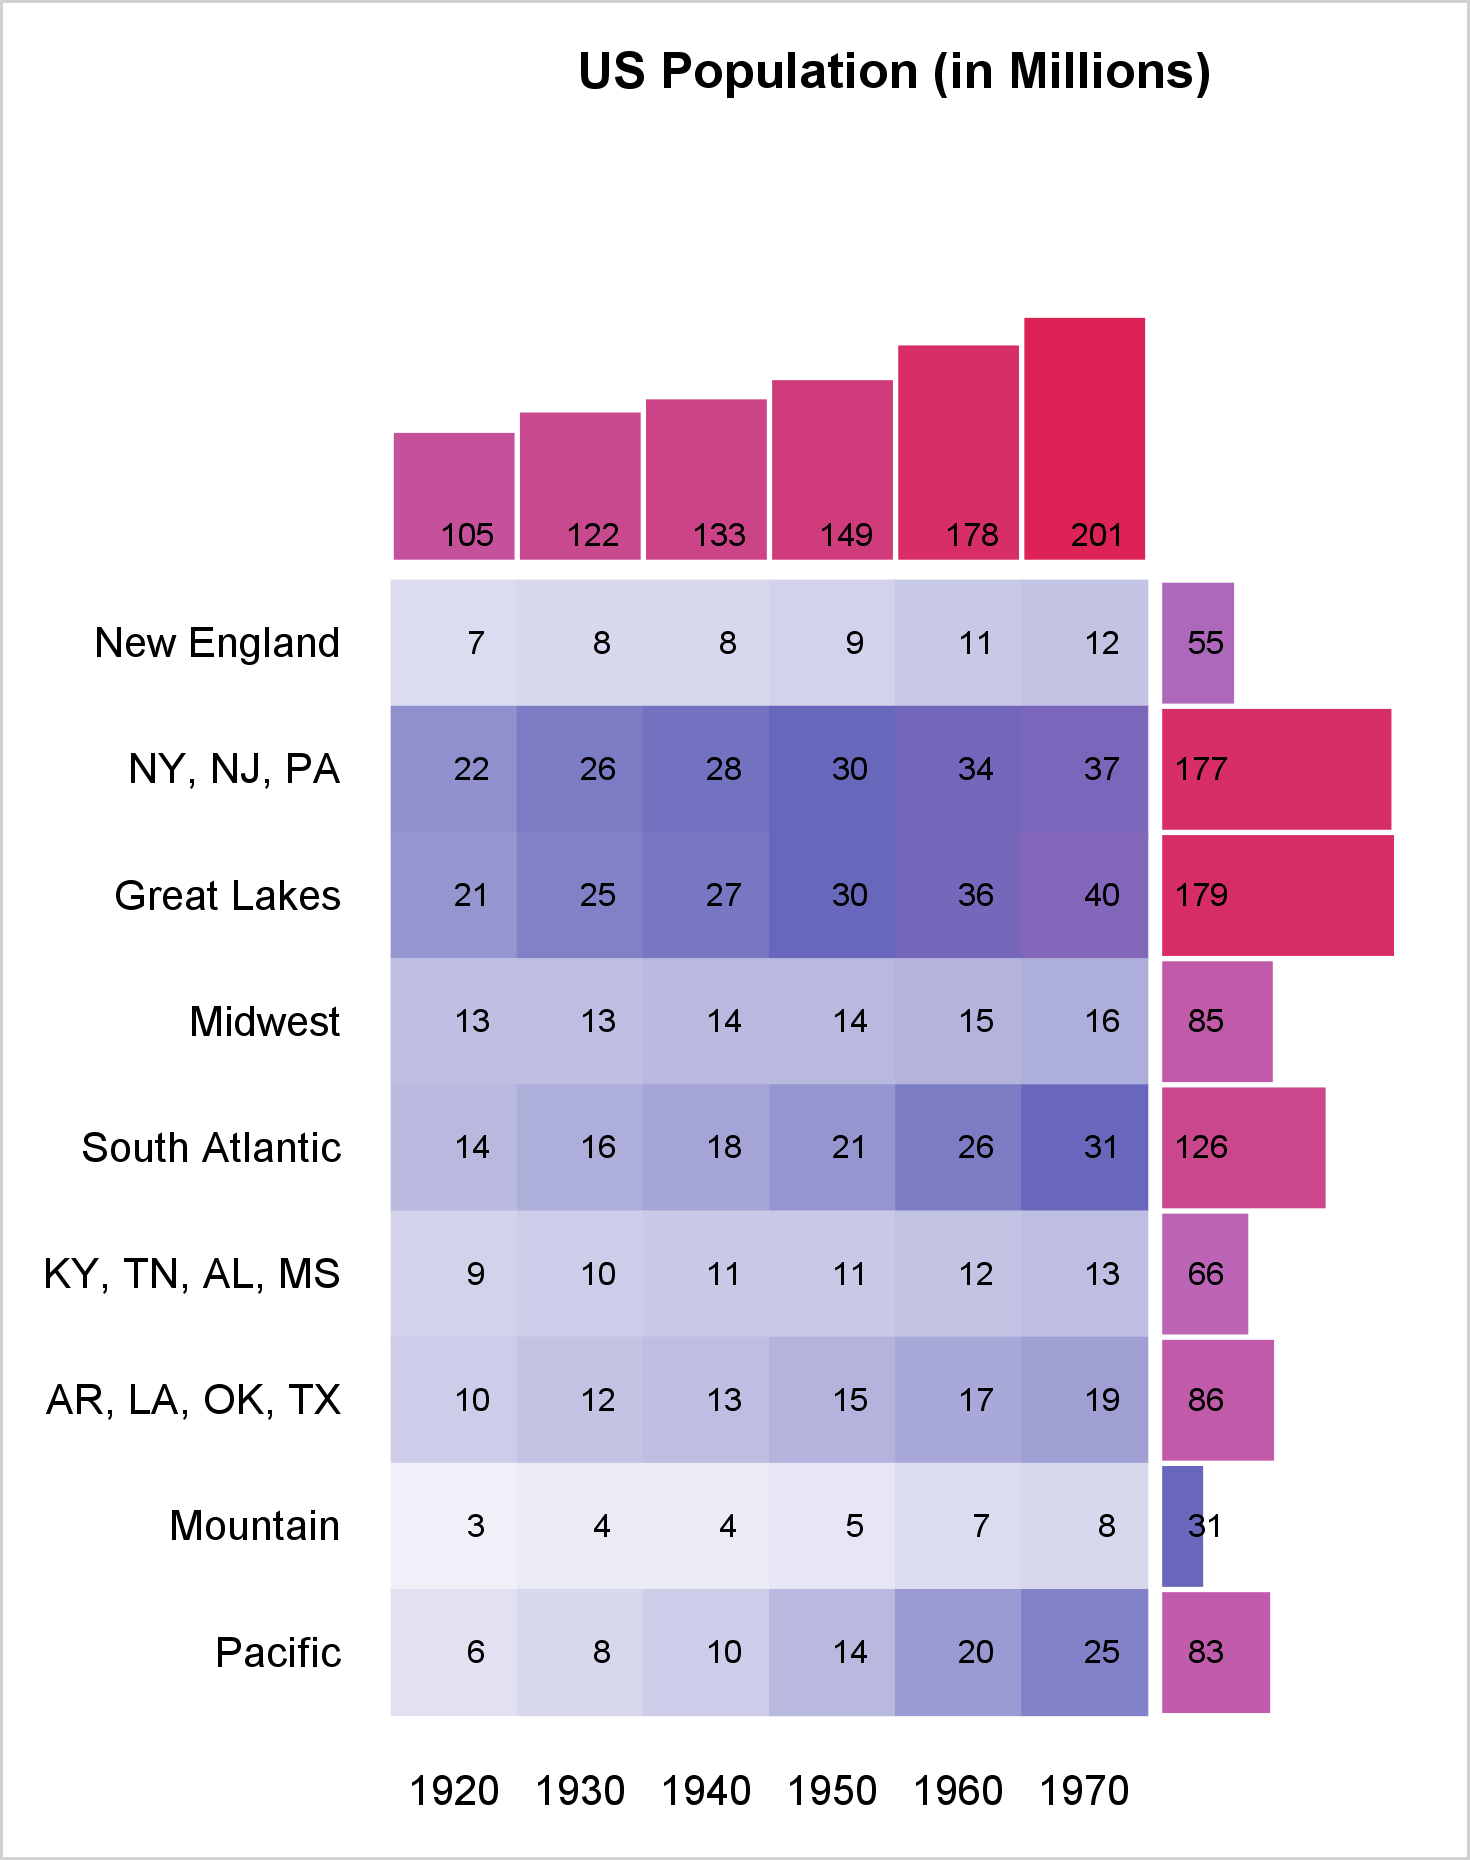

You can use a range attribute map to control the mapping of values in a continuous variable to colors. This post shows you how to use PROC SGPLOT to display multiple plots in the same graph and use range attribute maps.


The role of analytics in combating terrorism Earlier this spring, I found myself walking through a quiet and peaceful grove of spruce trees south of the small hamlet of Foy outside of Bastogne, Belgium. On travel in Europe, I happened to have some extra time before heading to London. I


The new government’s vision of Brexit is to make the UK a more international, more outward looking nation. One whose future success and status in on the world stage will be dictated by the ability to attract investment and finance, and to drive trade with existing and new partners. Yet

My presentation at SAS Global Forum 2017 was "More Than Matrices: SAS/IML Software Supports New Data Structures." The paper was published in the conference proceedings several months ago, but I recently recorded a short video that gives an overview of using the new data structures in SAS/IML 14.2: If your
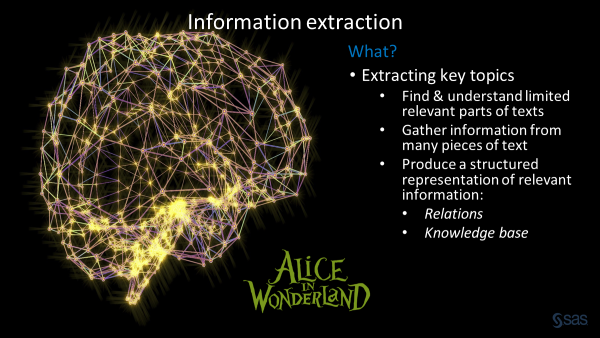

To demonstrate the power of text mining and the insights it can uncover, I used SAS Text Mining technologies to extract the underlying key topics of the children's classic Alice in Wonderland. I want to show you what Alice in Wonderland can tell us about both human intelligence and artificial

A new book from SAS guides public sector leaders in the use of data to address a wide range of state and local government challenges. Each chapter deals with critical issues facing our country, including the opioid epidemic, child abuse, spiraling health care costs, prison overcrowding, education reform, rampant fraud and the

La primera vez que alguien se refirió al Internet de las Cosas fue en 1999 y se trató del emprendedor Kevin Ashton, uno de los fundadores del centro Auto-ID en el MIT, quien lo acotó durante una presentación sobre la posibilidad de vincular objetos a través de la identificación por
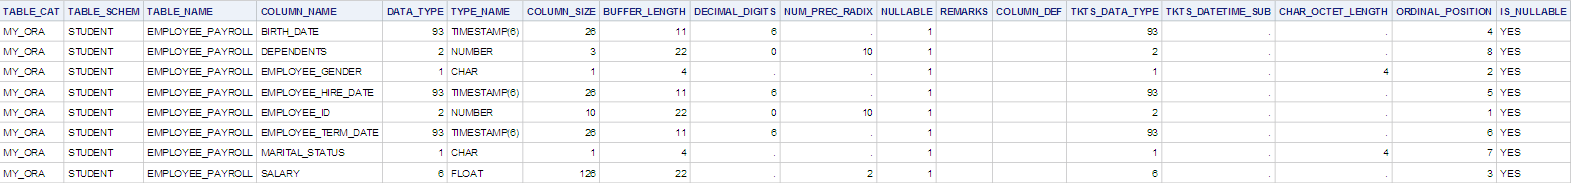

Dictionary tables are one of the things I love most about SQL! What a useful thing it is to be able to programmatically determine what your data looks like so you can write self-modifying and data-driven programs. While PROC SQL has a great set of dictionary tables, they all rely