All Posts


“Quick response forecasting (QRF) techniques are forecasting processes that can incorporate information quickly enough to act upon by agile supply chains” explained Dr. Larry Lapide, in a recent Journal of Business Forecasting column. The concept of QRF is based on updating demand forecasts to reflect real and rapid changes in demand, both


데이터 시각화 툴을 이용해 건물 지도, 층 설계, 기타 Esri 데이터를 디스플레이해야 한다면? 여기를 주목해주세요! 최근 ‘SAS 비주얼 애널리틱스 8.2(SAS Visual Analytics 8.2)’에 추가된 사용자 정의 폴리곤(polygon) 기능으로 여러 유형의 지역 오버레이를 렌더링할 수 있습니다. 일반적으로 보고서에 층 또는 건물 지도를 포함시킬 때 많이 사용되는데요. 오늘은 SAS 비주얼 애널리틱스로 실제 폴리곤을 등록하고,


My article about the difference between CLASS variables and BY variables in SAS focused on SAS analytical procedures. However, the BY statement is also useful in the SAS DATA step where it is used to merge data sets and to analyze data at the group level. When you use the
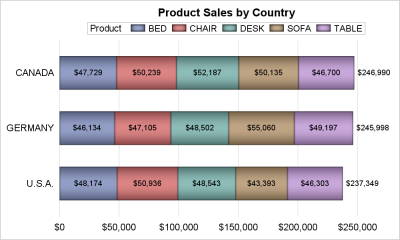

A common request on the communities page is to place data labels on horizontal bar charts. Often users want to display stacked horizontal bar charts, with the values displayed for each segment and the overall value of the bar itself as shown in the example below. In this example, the
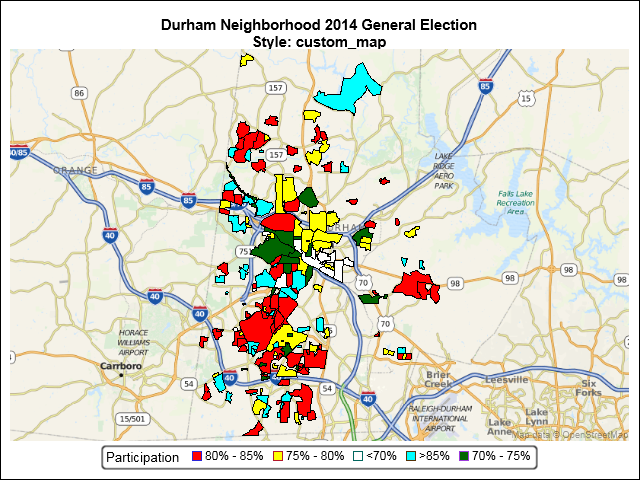

An earlier SGMAP blog used the BUBBLE statement to overlay point data on top of an Open Street Map. However, not all map features are points. Some are enclosed areas called polygons. Some map polygons share common borders such as states and counties. Others are separate, non-contiguous regions such as national parks


Thank you to Katie Pape, LPC for this Friday's guest post for the Work/Life Center 2018 Relationship Series. In a new relationship or a first date scenario, you might think you have to downplay who you are or change your persona to get a needed laugh from your interesting date,


Un informe de IDC a nivel mundial indica que los bancos invertirán más de 2,2 billones de dólares en Big Data y Analytics (soluciones que ayudan a la transformación exitosa) en 2018. Se conoció también que la mitad de las grandes entidades bancarias lanzarán al menos unas cinco aplicaciones que


David Loshin looks at two levels of data privacy concerns: exposure, and fair use of personal information.

Thanks to Amelia Kelley, PhD for this guest blog post for the Work/Life February Relationship Series. Trying to date and find a meaningful relationship can pose challenges to most any person who has ever tried. But when these challenges are coupled with a diagnosis of attention-deficit hyperactivity disorder, otherwise known

Las compañías del sector de Telcos en Colombia están a la espera de la gran subasta de bandas de 700 MHZ y 1.900 MHz, luego de que a finales de 2017 se aprobara un Decreto con el cual se aumentaban los topes máximos de espectro para bandas altas, pasando de
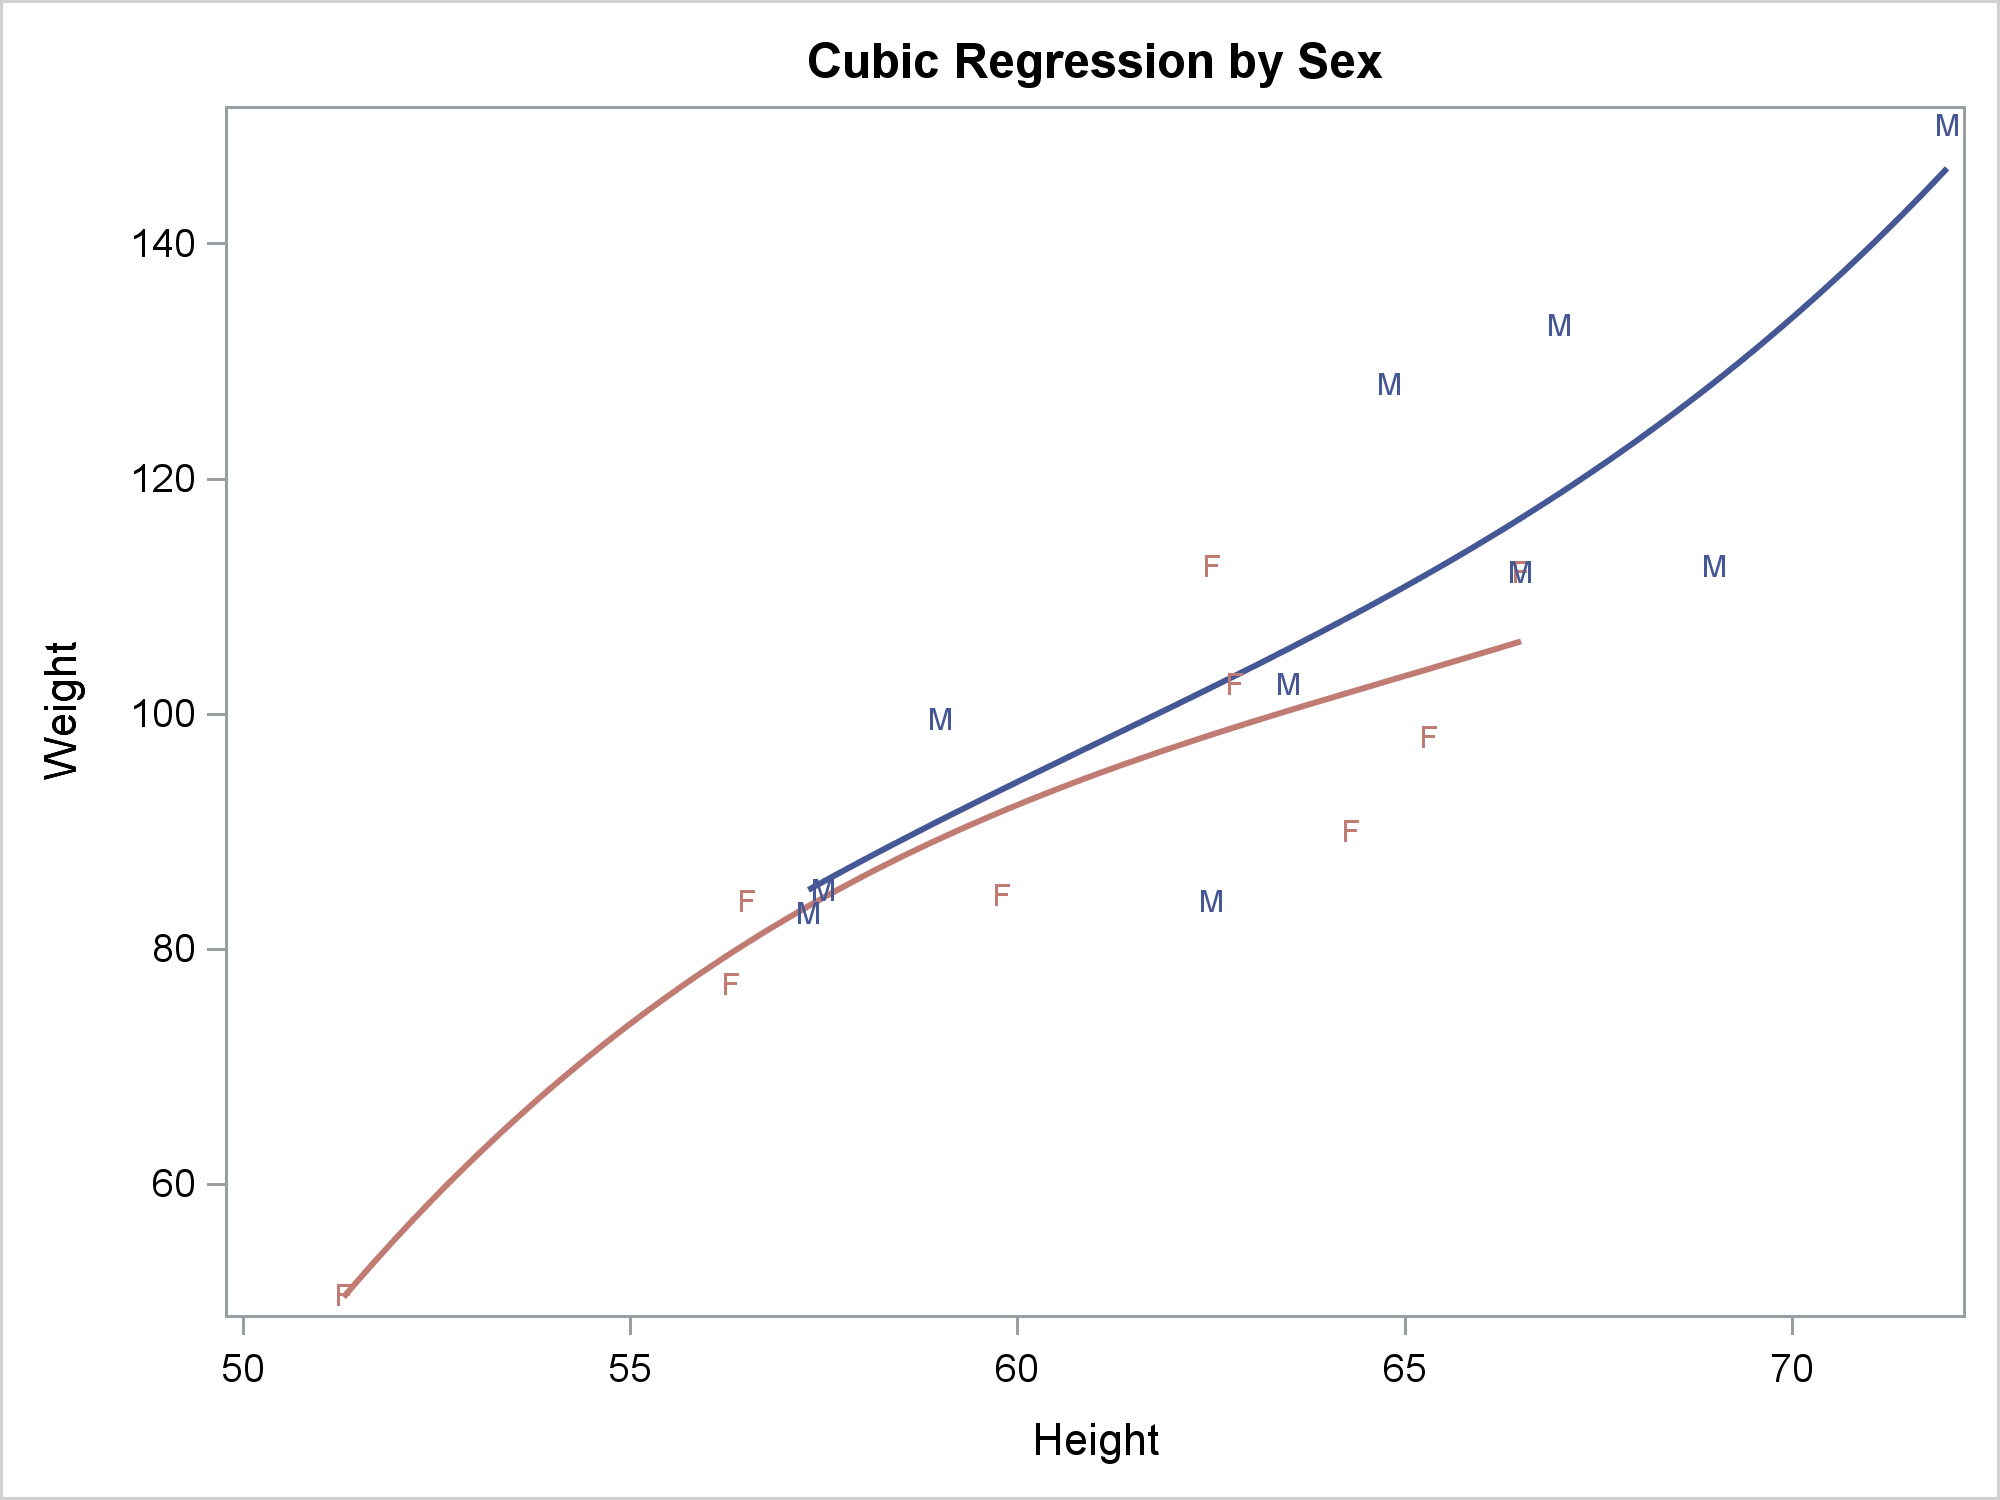

The REG statement fits linear regression models, displays the fit functions, and optionally displays the data values. You can fit a line or a polynomial curve. You can fit a single function or when you have a group variable, fit multiple functions.
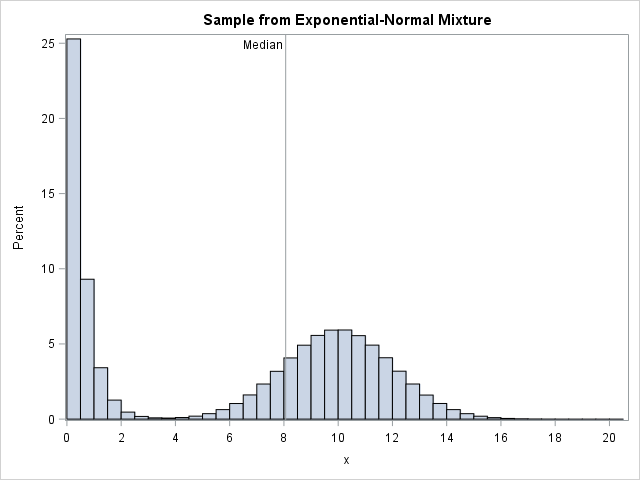
This article describes and implements a fast algorithm that estimates a median for very large samples. The traditional median estimate sorts a sample of size N and returns the middle value (when N is odd). The algorithm in this article uses Monte Carlo techniques to estimate the median much faster.


Here are some new tips for masking. The new EU General Data Protection Regulation (GDPR) requires your company to implement (quote) all necessary technical and organizational measures and to take into consideration the available technology at the time of the processing and technological developments. So, how can you comply with

You work with data. Data about your customers. It's likely that your customers' identity could be determined from the data you’ve collected. Starting in May 2018, a new data protection law will be in effect. This means you’re going to have to document which technical measures you’ve implemented to prevent your


Un minorista busca siempre conocer los hábitos de compra y venta de los compradores con los beneficios de los productos, el surtido, las promociones y los precios que se adecúen perfectamente a su estilo de vida. De acuerdo, puede diseñar campañas de marketing más enfocadas, afinar su cadena de suministro,