All Posts
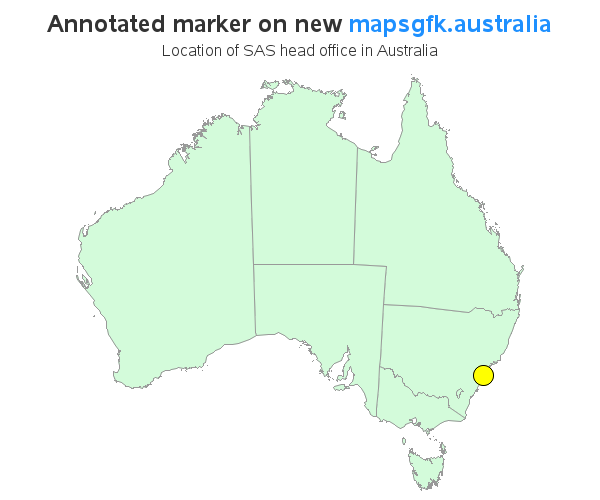

Do you procrastinate and find excuses to delay doing certain things, even when you know they really ought to be done? And you probably realize that starting those projects is usually the hardest part, eh? Well, I finally started converting hundreds of my SAS examples to use the new GfK maps,
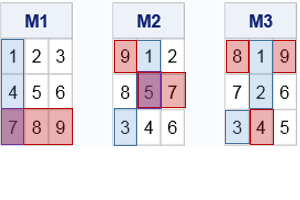

Many people know that a surface can contain a saddle point, but did you know that you can define the saddle point of a matrix? Saddle points in matrices are somewhat rare, which means that if you choose a random matrix you are unlikely to choose one that has a
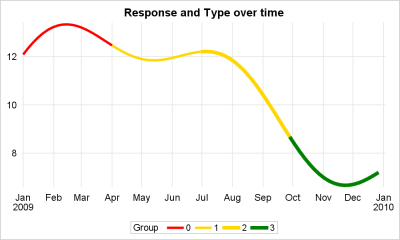

This article is motivated by a recent question on the SAS Communities board. This user wants to create a series or spline plot where the attributes of the line (color, thickness) can be changed based on another variable. In this case it may be a binary variable with "0" and
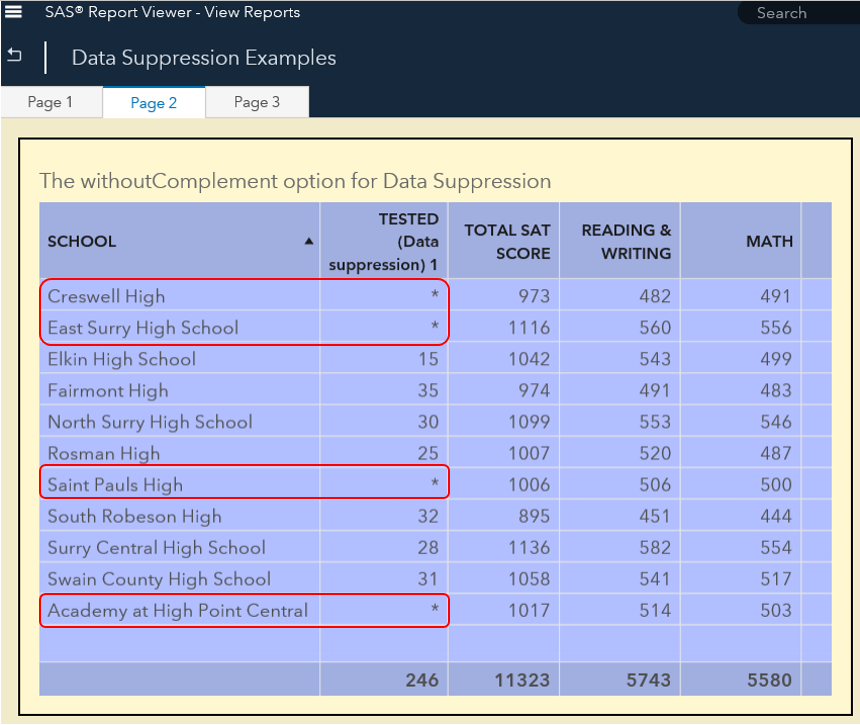

Report data shared by educational institutions, government agencies, healthcare organizations, and human resource departments can contain sensitive or confidential data. Data in such reports are suppressed selectively to protect the identities of individuals or to prevent the report’s audience from easily inferring individual values. The Data Suppression feature in SAS


You’ve probably heard the stats about the number of internet-connected devices, which make up the Internet of Things (IoT). Most likely, you’re part of the narrative. We're all connected in new ways and through more devices than ever before. Sometimes IoT impacts our daily lives – safety sensors on cars,
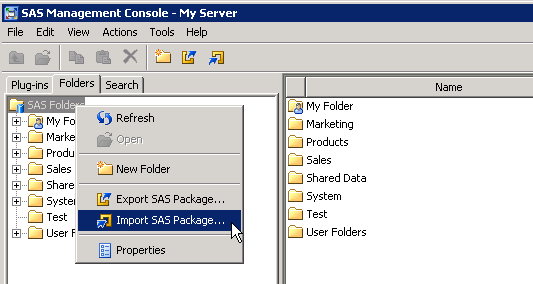

Let’s say that you are administering a SAS 9.4 environment that is working just fine. You’ve checked that your full backups are indeed happening and you’ve even tried restoring from one of your backups. You are prepared for anything, right? Well, I’d like to propose a scenario to you. You

It’s been quite an interesting Winter, one that was predicted by the Farmer’s Almanac to be cold and wet. Cold? Not so much. Wet? Painfully so! Parts of it have been beautiful, though, including an unexpected snow storm in January that covered our area in 10 – 12 inches of
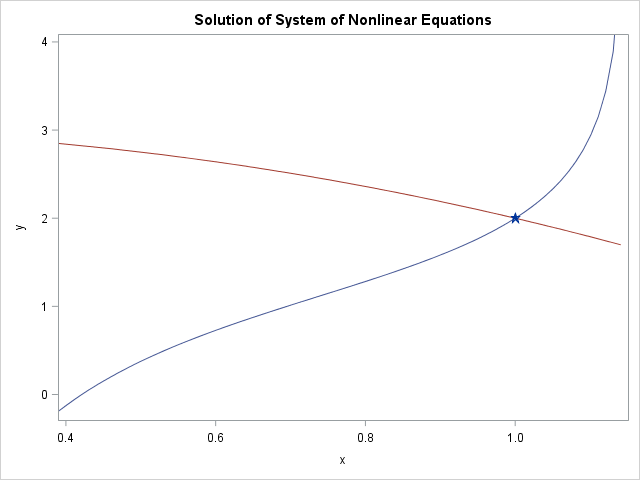
This article shows how to use SAS to solve a system of nonlinear equations. When there are n unknowns and n equations, this problem is equivalent to finding a multivariate root of a vector-valued function F(x) = 0 because you can always write the system as f1(x1, x2, ..., xn)


Part 5 of this series brings us to Rotterdam again, where I met with the two Notilyze founders Colin Nugteren and Tom Dogger. Both of them studied econometrics in Rotterdam, but go back as far as the F4 soccer team they were both playing in as kids. Company overview The


Goutam Chakraborty is a busy man. In addition to serving as SAS professor of marketing analytics at Oklahoma State University, Dr. Chakraborty is the director and founder of the SAS and Oklahoma State University MS in Business Analytics and an award winning author and professor. He teaches courses in such areas as business
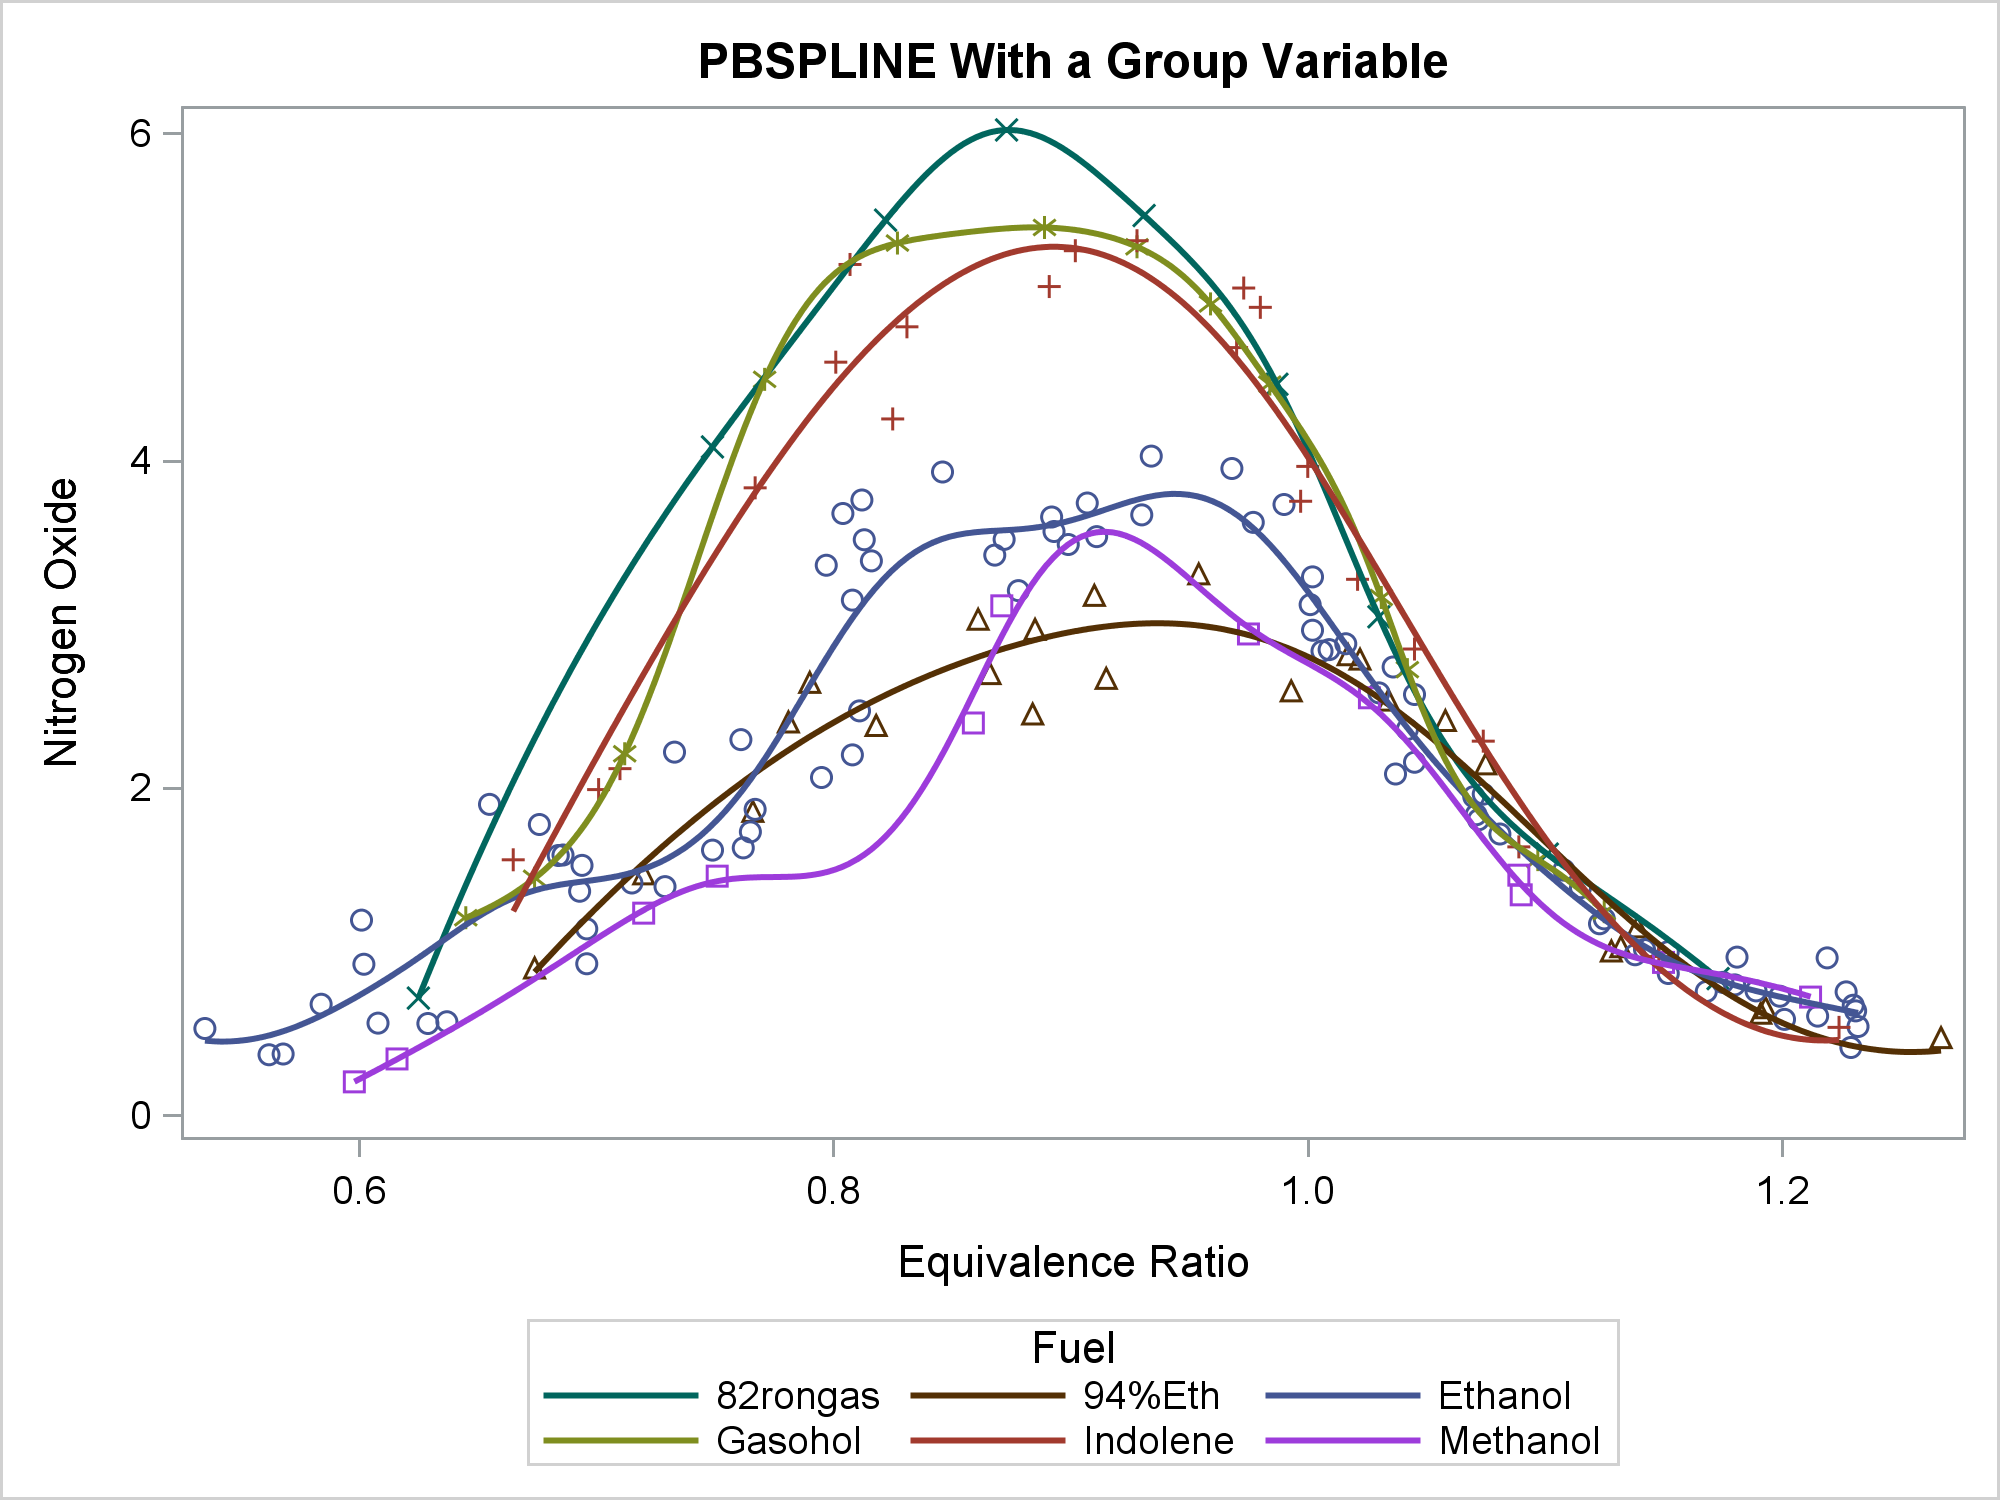

You can use penalized B-splines display a smooth curve through a set of data. The PBSPLINE statement fits spline models, displays the fit function(s), and optionally displays the data values.


Chess has been intertwined with Computer Science since, well ... forever. Long before supercomputer Deep Blue, loaded with human-crafted chess algorithms, beat reigning world champion Garry Kasparov in 1997. Well before AlphaZero AI defeated all of human chess knowledge with just a few hours of study. Way before computers even


La información genómica, las pruebas clínicas, los expedientes médicos electrónicos, los estudios de investigación y los resultados de las investigaciones pueden derivar en descubrimientos relevantes y apoyar a las autoridades sanitarias para tomar mejores decisiones. Como muchas otras disciplinas tecnológicas, la analítica se está aprovechando para hacer frente a las


I remember going to a workshop about grief a few years back. At one point, the speaker talked about various types of support grieving folks need after the typical mourning rituals have receded and life continues on. He asked the workshop participants to pull out a sheet of paper and


Los insights de los clientes probablemente sean el instrumento más efectivo para lograr el awareness que desea una marca. Según Gartner, “solo el 23% de las compañías son capaces de integrar insights de clientes en sus operaciones”. Un cliente satisfecho comparte en promedio con 6 personas sus experiencias de compra,