All Posts

As a general rule, when SAS programmers want to manipulate data row by row, they reach for the SAS DATA step. When the computation requires column statistics, the SQL procedure is also useful. When both row and column operations are required, the SAS/IML language is a powerful addition to a


Inspired by curiosity and backed by the most powerful analytics in the world, SAS discovers a new planet in our Solar system. See how we used SAS Viya to make this historic discovery.


Gradient boosting is one of the most widely used machine learning models in practice. See how to use gradient boosting model for classification in SAS Visual Data Mining and Machine Learning.
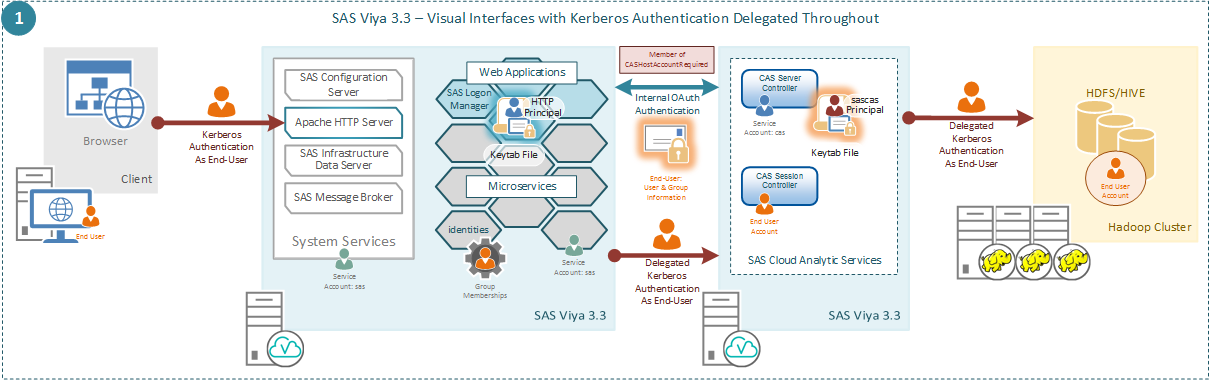

Learn about the new feature of SAS Viya 3.3 that enables Kerberos delegation throughout the environment. It allows you to have end-user sessions in SAS Cloud Analytics Services that are able to use Kerberos to connect to Secured Hadoop.
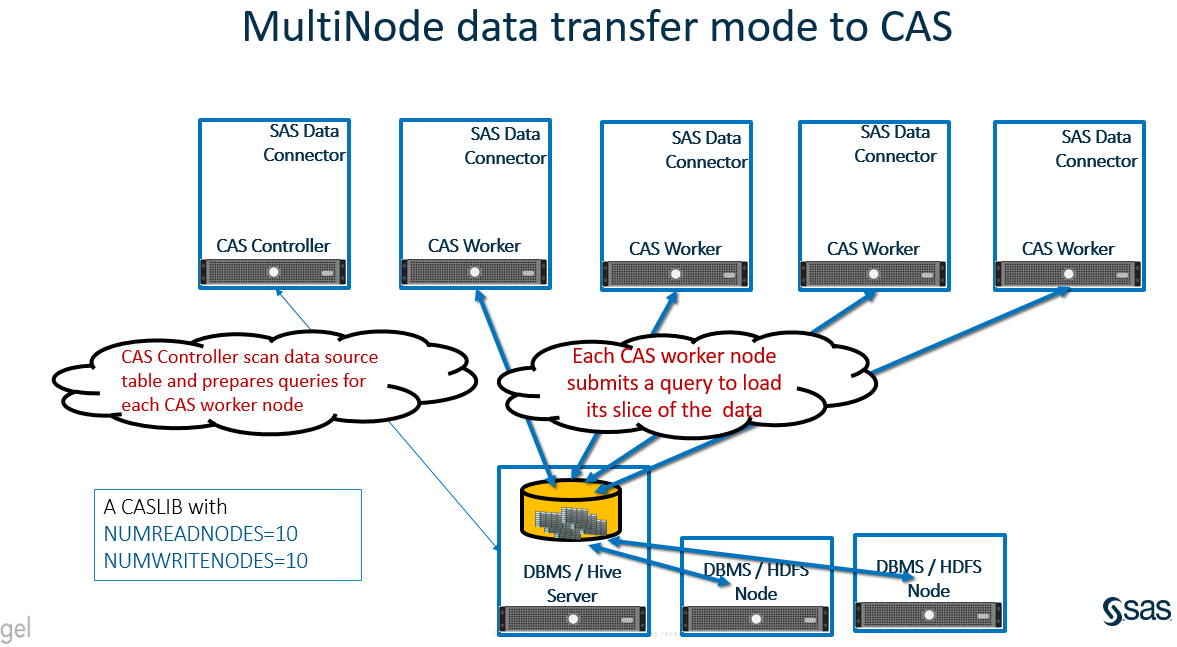

With SAS Viya 3.3, a new data transfer mechanism Multi Node Data Transfer has been introduced to transfer data between the data source and the SAS’ Cloud Analytics Services. Learn more about this feature.

SAS product manager, author and community contributor Gerhard Svolba shares 10 reasons to look forward to SAS Global Forum 2018.
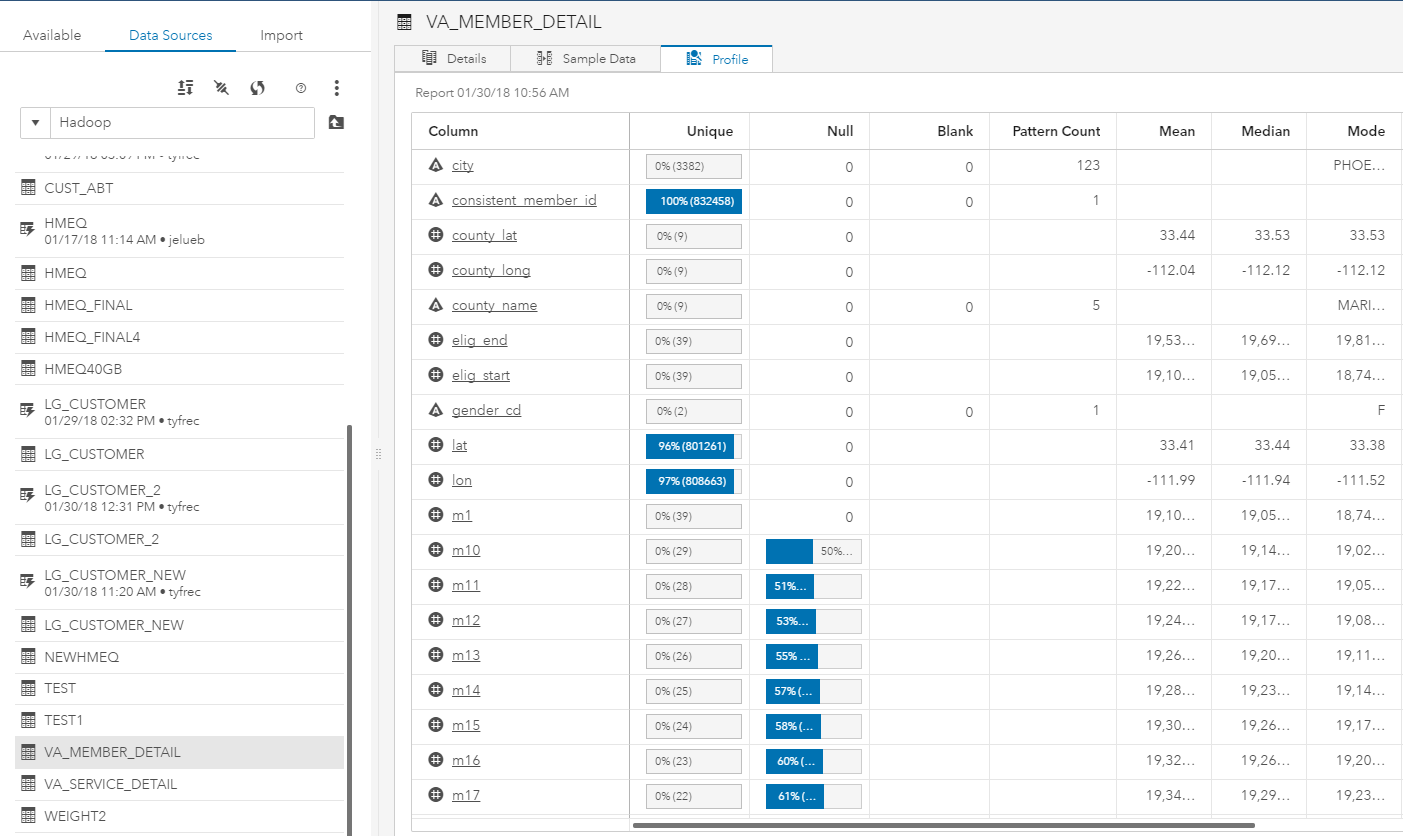

With the release of SAS Viya 3.3, you now have the ability to pass implicit SQL queries to a variety of SQL data sources, including Hive. Here's what happens as users write SAS compliant SQL code.


2016년 4월 유럽 일반개인정보보호법(GDPR; General Data Protection Regulation)이 채택됐을 때만해도 2018년 5월 25일 법률 시행일은 멀게만 느껴졌는데요. 23년만에 찾아온 대대적인 개편! 새로운 유럽 개인정보보호법(European data privacy laws)의 시행까지 이제 단 몇 주밖에 남지 않았습니다. 오늘은 GDPR이 무엇인지, 기업에 어떤 영향을 미치는지, 개인 정보 활용 동의를 어떻게 관리할 것인지 등에 대한 전반적인 논의부터
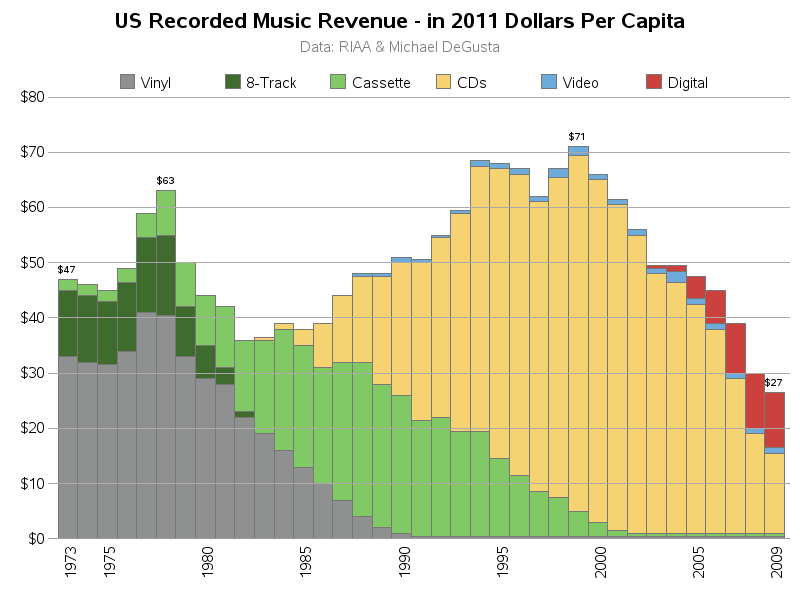

These days, it's all about music streaming ... You sign up for a service, you let them know your music preferences, and they create a virtual "radio station" that plays the songs you probably want to hear. But that just doesn't compare with going to a physical record store, buying


The egg aisle is a confusing place! The egg cartons are plastered with pictures of happy chickens and seemingly healthy terms like farm fresh, natural, organic, free range, and cage free. So many options can make your head spin! How do you decide which one to buy? Let’s dig a
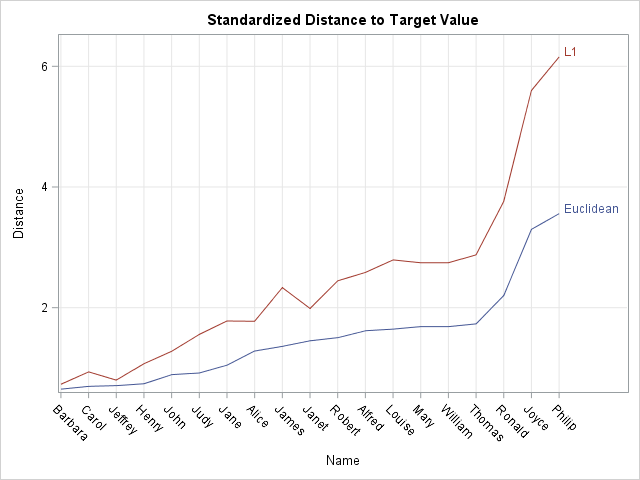
Suppose you want to find observations in multivariate data that are closest to a numerical target value. For example, for the students in the Sashelp.Class data set, you might want to find the students whose (Age, Height, Weight) values are closest to the triplet (13, 62, 100). The way to


Kim Kaluba gives examples of the benefits of data governance for data lakes.


+Las empresas de todo el mundo están cambiando radicalmente su manera de operar y de relacionarse con clientes y socios. Se encuentran en plena transformación digital y capitalizan tendencias clave para evolucionar, como la nube, el Internet de las Cosas, la inteligencia artificial y la analítica, entre otras. De igual


Working in hospice I learned there was nothing I could say to erase a person’s pain, sadness, anger etc. I didn’t have that power and it would be irresponsible to think that I did. However, through education, I found that I could often ease the unnecessary additional suffering caused by misinformation and

At SAS we use data to accomplish many of our everyday tasks. At SAS Books, we have now even used data to create a data-driven book, An Introduction to SAS Visual Analytics.