All Posts


Joyce Norris-Montanari shares insights and tips about data security and privacy.


El impacto que tienen los datos en el mundo es extraordinario. Por eso, quienes buscan aprovecharlos tienen en sus manos un futuro lleno de oportunidades. Esto es visible, especialmente ahora, cuando las empresas están cada vez más interesadas en conocer realmente a sus clientes para brindarles mejores ofertas. Como una

For those of you who weren't able to attend SAS Global Forum 2018, you can still learn a lot from the content shared there. Gain knowledge from your SAS family. SAS Global Forum 2018 papers and videos now available.


This is, hands down, the question I am most frequently asked. Unfortunately, there is no simple answer. The response depends on a combination of factors including (but not limited to) the type of care required and the income and assets of the person in need of care.


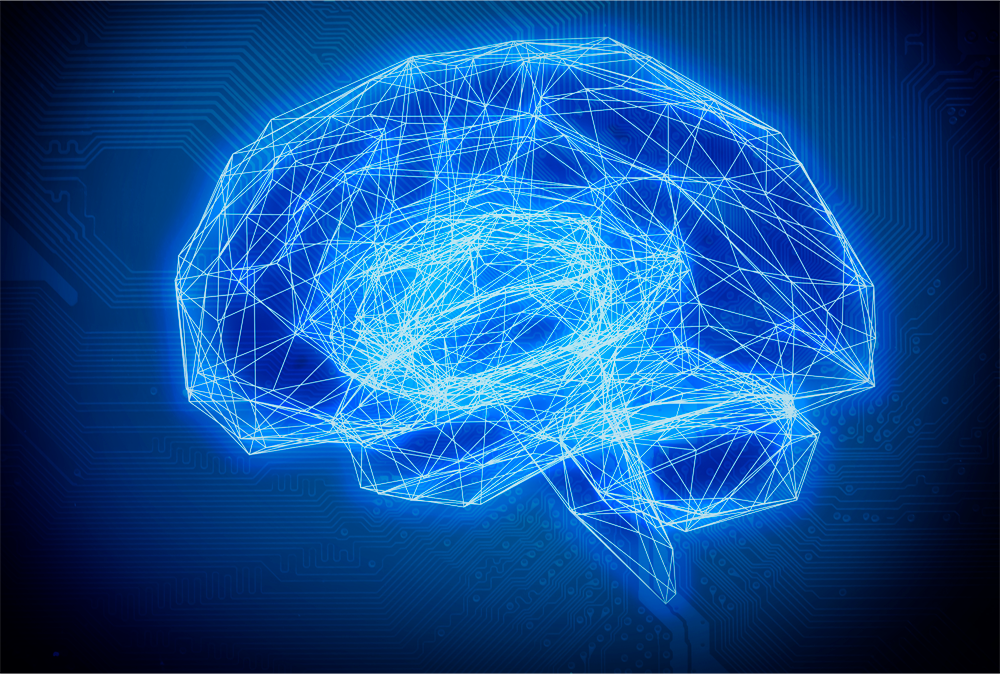
소비자들은 다양한 산업에 빠르게 도입되고 있는 인공지능(AI)을 어떻게 받아들이고 있을까요? SAS가 최근 미국인 500명을 대상으로 조사한 결과, 소비자들은 금융이나 소매 분야보다 의료 산업의 인공지능 기술을 더욱 편안하게 여기는 것으로 나타났습니다. 특히 응답자의 47%는 수술 중에도 기꺼이 인공지능 기술의 도움을 받겠다고 답했는데요. 또 10명 중 6명(60%)은 의사가 애플워치나 핏비트와 같은 웨어러블 기기의 데이터를


I first heard about blender muffins maybe a year ago. Muffins made with no flour, and you just dump all the ingredients into a blender? Uh, ok. My little one was starting finger foods at the time, so I figured I’d give these recipes a shot. They were a hit!
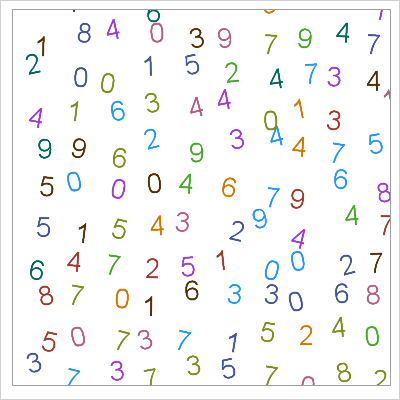

In a previous blog post, I discussed ways to produce statistically independent samples from a random number generator (RNG). The best way is to generate all samples from one stream. However, if your program uses two or more SAS DATA steps to simulate the data, you cannot use the same
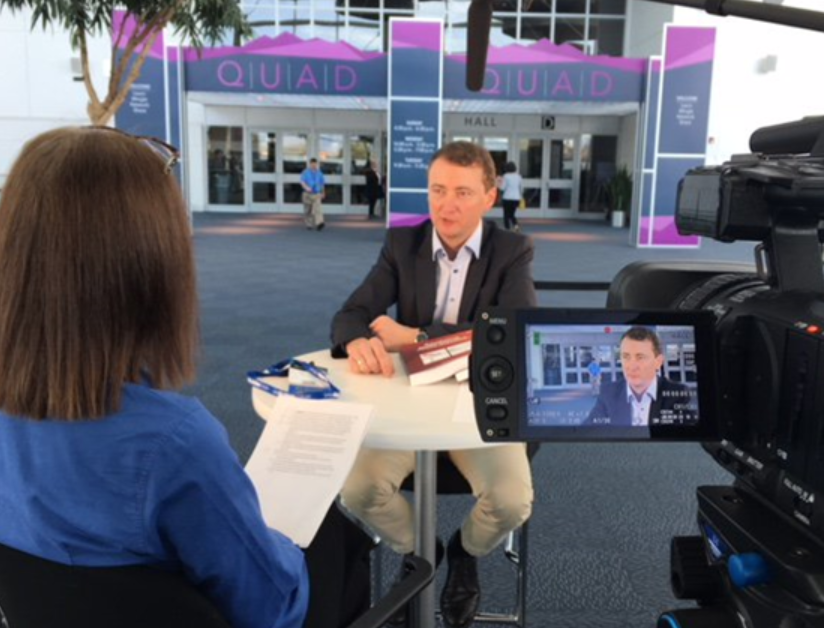

In this blog post you'll find out the top 10 bestselling titles at SAS Global Forum 2018.

La medida en que las organizaciones se beneficien de la Inteligencia Artificial, machine learning y la analítica dependerá de sus necesidades y la aplicación que puedan tener para hacerlas más rentables, ágiles y competitivas. La inteligencia artificial (IA) ha estado presente en nuestras vidas más tiempo del que creemos. Está


I have good news to share about the future. Despite what you may have heard elsewhere, the future of work in a world with artificial intelligence (AI) is not all doom and gloom. And thanks to a research-backed book from Malcolm Frank, What to Do When Machines Do Everything, we


WARNING: This blog post references Avengers: Infinity War and contains story spoilers. But it also contains useful information about random number generators (RNGs) -- tempting! If you haven't yet seen the movie, you should make peace with this inner conflict before reading on. Throughout the movie, Thanos makes it clear


The European Union’s General Data Protection Regulation (GDPR) taking effect on 25 May 2018 pertains not only to organizations located within the EU; it applies to all companies processing and holding the personal data of data subjects residing in the European Union, regardless of the company’s location. Here are four selected SAS tools for GDPR that allow you to protect personal data in SAS reports by suppressing counts in small demographic group reports.

Datasets can present themselves in different ways. Identical data can bet arranged differently, often as wide or tall datasets. Generally, the tall dataset is better. Learn how to convert wide data into tall data with PROC TRANSPOSE.
Do you periodically delete unneeded global macro variables? You should! Deleting macro variables releases memory and keeps your symbol table clean. Learn how the macro language statement that deletes global macro variables and about the %DELETEALL statement that can be a life saver for macro programmers.
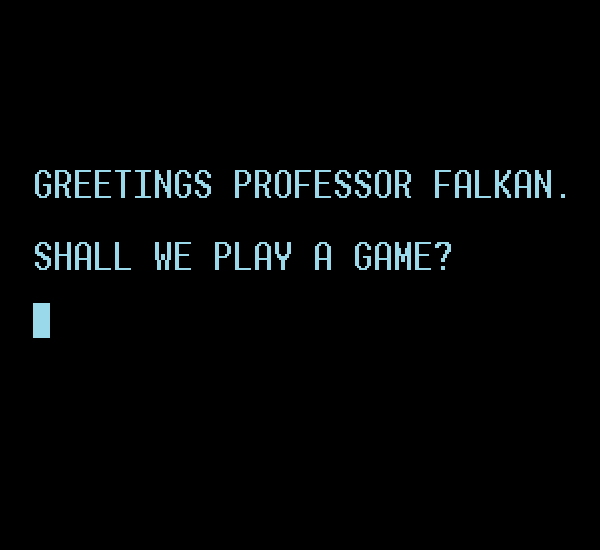

Remember the military computer Joshua from the 1983 Matthew Broderick movie WarGames? Joshua learned how to “play a game” by competing against other computers, got confused about reality, and nearly started WWIII. As depicted in that movie, Joshua isn’t all that different from Google’s DeepMind, which became a superhuman chess