All Posts
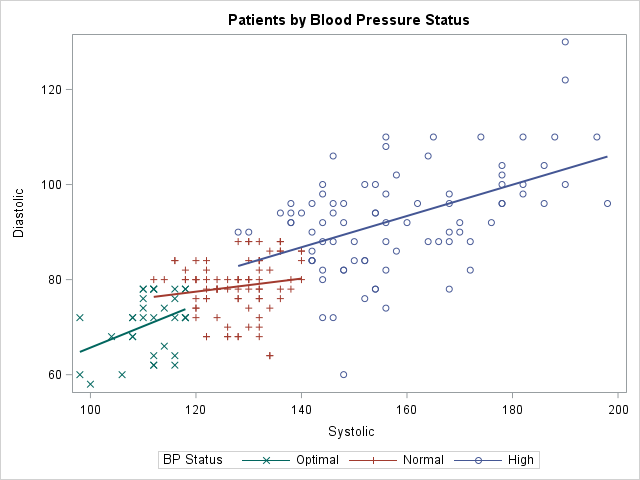

When a graph includes several markers or line styles, it is often useful to create a legend that explains the relationship between the data and the symbols, color, and line styles in the graph. The SGPLOT procedure does a good job of automatically creating and placing a legend for most


En este mundo interconectado en el que vivimos, ser un competidor fuerte en la economía digital es, además de importante, clave para alcanzar grandes resultados. Por tener gran influencia en los procesos internos de gestión, así como en las operaciones que se desarrollan de cara a los clientes, la Analítica


머신러닝의 블랙 박스 모델을 소개하는 첫 번째 블로그와 두 번째 블로그를 통해서 머신러닝 모델의 복잡성과 머신러닝의 뛰어난 예측 결과를 활용할 수 있는 해석력이 필요한 이유, 적용 분야에 대해서 소개해드렸는데요. 이번에는 기업 실무자 입장에서 SAS 비주얼 데이터 마이닝 앤드 머신러닝(SAS Visual Data Mining and Machine Learning)을 활용한 SAS 커스터머 인텔리전스 360(SAS Customer Intelligence 360)에서 해석 기법과


Whether you're reading industry articles about smart tags or analyst reports about inventory tracking, you've probably noticed an uptick in coverage on the adoption of IoT (and RFID) in retail. Since I've been following these topics for awhile, I've decided to dedicate a series of posts on the ways IoT can be used
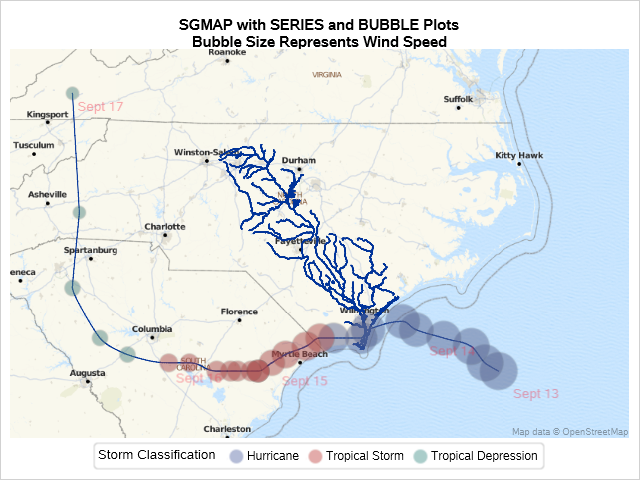

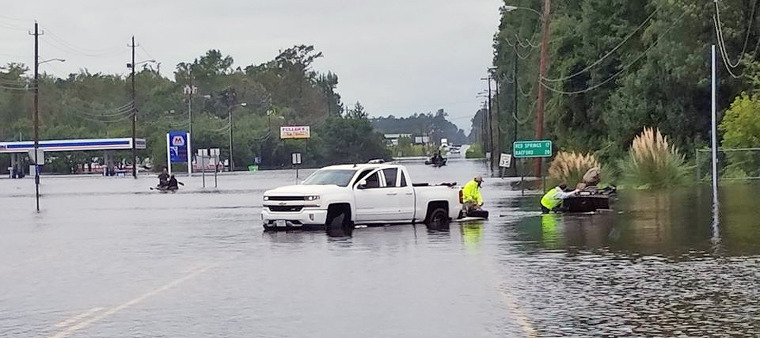
In August 2018, Hurricane Florence came on shore in North Carolina. Much of the damage was from flooding because the storm moved slowly over North and South Carolina. Parts of North Carolina had over 30 inches of rain from the storm, and this caused many of North Carolina’s rivers to


La prova definitiva per poter definire una tecnologia “mainstream” consiste nel verificare che essa venga ampiamente utilizzata in tutta l'azienda, dalle funzioni a servizio del cliente alle attività di back-office. Gli analytics sono stati a lungo incentrati sul cliente ed ampiamente utilizzati anche per le prestazioni individuali, ad esempio, dalle

Find out what SAS Global Forum 2019 conference chair MaryAnne DePesquo says about the upcoming conference in Dallas.


I first used telemedicine (the remote diagnosis and treatment of patients by means of telecommunications technology) in the mid-90s when I was working as an on-call CT technician in the UK. We used a modem to transfer head trauma scans to the local neurology center for assessment so that the


This blog post shows a few samples of graphs and explains how you can use new functionality in ODS Graphics to make your old graphs look new again. ODS Graphics is part of Base SAS.
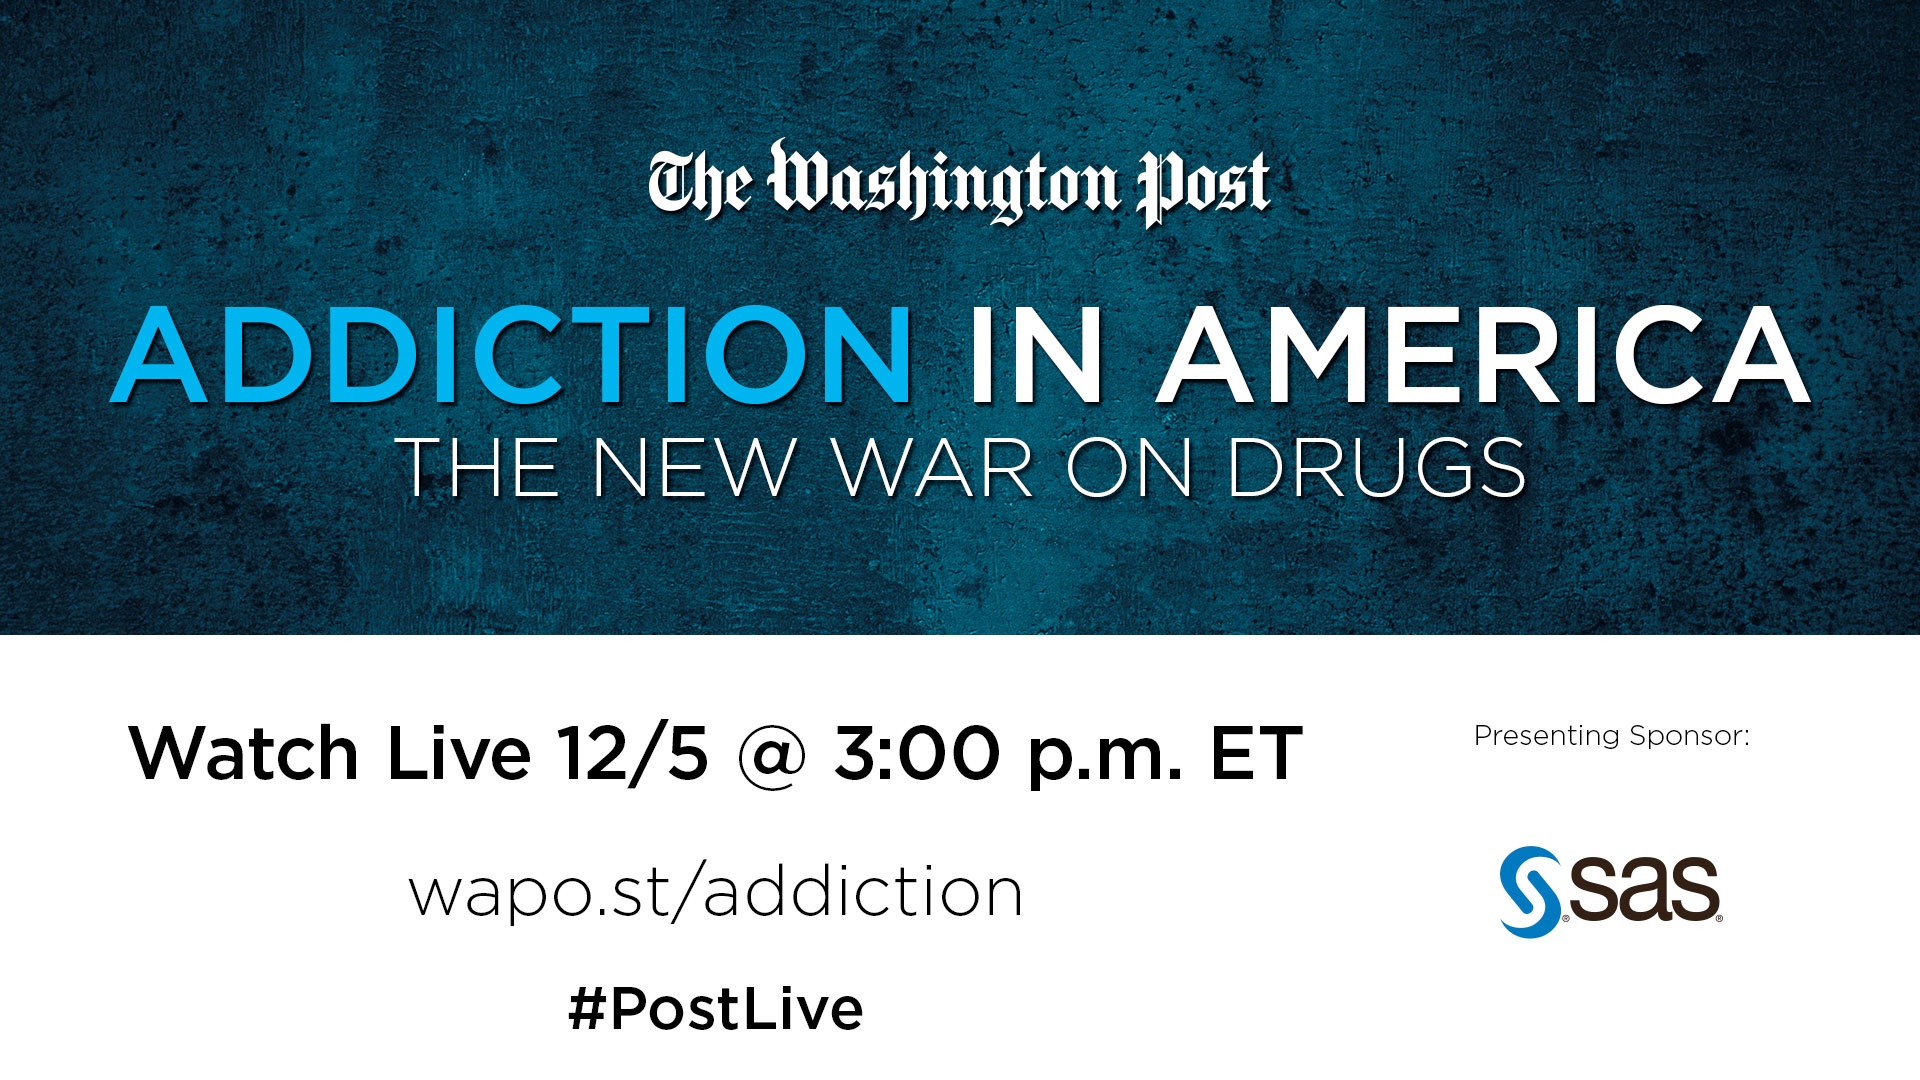

The opioid epidemic continues to be one of the largest challenges facing the United States. In 2016, more than 42,000 Americans died from opioid overdoses, and that number continues to climb. Recent data shows that more than 130 people die every day in the United States after overdosing on opioids,


Cast iron skillets seem to intimidate many of us. With all the do’s and don’ts, they may seem like a lot of work, but once you get the hang of how to take care of them, they’re a breeze and a great safe cookware option.
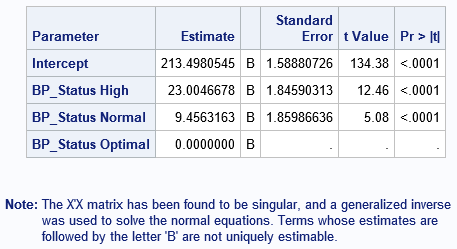
I remember the first time I used PROC GLM in SAS to include a classification effect in a regression model. I thought I had done something wrong because the parameter estimates table was followed by a scary-looking note: Note: The X'X matrix has been found to be singular, and a


Yesterday I heard someone recount a story of arriving to a show only to realize their tickets were for the next week. As I heard this story, I had flashbacks to Thanksgiving a few years ago, arriving to a vacation rental home on the wrong week. I wrote a post


Jim Harris says data stewards are essential to analytics, providing life cycle management for data across the enterprise.
초강력 허리케인 '플로렌스’ 미국 남동부 지역을 강타하다 지난 9월, 대서양에서 발생한 초강력 허리케인 '플로렌스(Florence)'가 미국 노스캐롤라이나주를 비롯한 미국 남동부 지역을 강타했습니다. 하루 무려에 762mm 기록적 물폭탄이 내리면서 허리케인으로 인한 재산 피해액은 총 170~220억달러(약 19조~25조원) 인것으로 추정되기도 했는데요. 허리케인 플로렌스가 쓸고 간 자리에는 집, 일자리, 건물, 학교 등을 잃은 이재민들이 남았습니다.