All Posts


If a bank gets in touch with a software company and wants to know how it could use artificial intelligence (AI), that means two things. First, the bank is willing to consider AI, and second, that it really does not know much about the subject. Banks want AI, and they


¿Cuál es el futuro de la televisión de paga en un mercado donde los servicios de streaming ganan terreno a gran velocidad? Al responder, hay quienes están convencidos de que conservará su reinado por mucho tiempo más; otros auguran un franco declive en el mediano plazo. De acuerdo con firmas


Ante el riesgo de simplificar en exceso, considero que la Inteligencia Artificial (IA) es lo que se vuelve posible después que se ha adoptado totalmente el uso de la analítica y es posible tener mayor audacia sobre cómo utilizarlo para tomar mejores decisiones. Sus modelos mejoran, sus predicciones son más

L’intelligence artificielle, dont les prémices remontent aux années 1950, se concrétise déjà depuis une dizaine d’années dans le secteur de la santé. Les applications de l’IA dans les hôpitaux apportent de nombreux bénéfices aux patients, équipes médicales et établissements de santé. Jean-François Gourdin, responsable du secteur santé chez SAS, épidémiologiste


Anti-money laundering has been an issue for banks and financial institutions for some time. Transaction monitoring systems have been around for many years. Meeting and complying with regulations at the regional or national level, however, remains a challenge. Many financial institutions are almost playing catch-up with regulators, as anti-money laundering
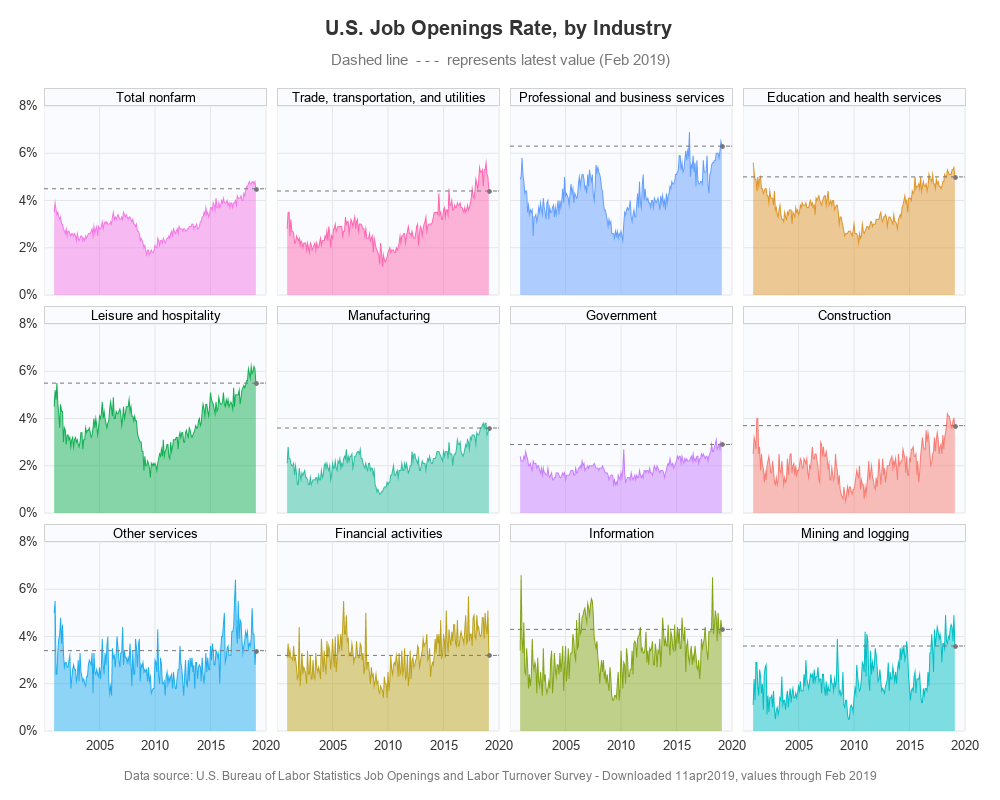

In the past, I created some graphs about our record low unemployment rate (US unemployment, and state-level unemployment), but does low unemployment also mean there are jobs available? Let's have a look at the data!... Existing Graphs I knew I couldn't be the only one interested in this kind of
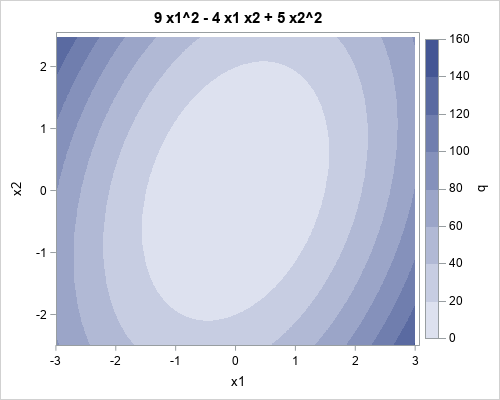

A quadratic form is a second-degree polynomial that does not have any linear or constant terms. For multivariate polynomials, you can quickly evaluate a quadratic form by using the matrix expression x` A x This computation is straightforward in a matrix language such as SAS/IML. However, some computations in statistics


More and more organizations are moving to the cloud, but for some moving data isn’t an option. With a remote managed software and services (RMSS) solution deployment, however, it’s still possible to experience the benefits of cloud, without the data or solution ever leaving your premises or existing cloud provider.


Which topics and priorities will be the focus for chief risk officers in 2019? A range of experts and representatives of major banking institutions addressed these questions at a recent event, CRO and CFO Banking Agenda 2019, organised by CeTIF, the Research Center on Technologies, Innovation and Financial Services, in collaboration


At the end of my SAS Users blog post explaining how to install SAS Viya on the Azure Cloud for a SAS Hackathon in the Nordics, I promised to provide some technical background. I ended up with only one manual step by launching a shell script from a Linux machine


Anti-money laundering is an important issue for governments and banks alike. The fight to prevent terrorist financing and profiting from crime means that banks and other financial institutions are increasingly required by regulations to put anti-money laundering systems in place. Many are turning to analytics in the process, and particularly to

At the risk of oversimplifying, I think of artificial intelligence as what becomes possible after you’ve fully embraced analytics and you’re starting to get bolder about how to use it. Your models are getting better, your predictions are more accurate, your results are stronger and over all, confidence grows in


Además de mejorar la eficiencia de las organizaciones, con el aprovechamiento del Big Data, las instituciones pueden gestionar información que los ayude a responder a las necesidades de los ciudadanos. Su uso en el sector del gobierno, por ejemplo, contribuye a mejorar la comprensión de los fenómenos sociales y apoyar

Et si, en dehors de la nouvelle organisation des moyens de production, la 4ème révolution industrielle induisait également une évolution significative dans la gestion de la connaissance intrinsèque à chaque domaine ? Et si les nouvelles technologies numériques permettaient aux acteurs opérationnels d’accéder simplement à cette connaissance, le plus souvent fruit de méthodes

El desplazamiento de la Analítica Avanzada a plataformas en la nube es una estrategia que busca aportar mayor valor a los procesos que se desarrollan al interior de las empresas. Para lograr que este cambio sea exitoso, es importante encontrar el momento adecuado para iniciar esta fase de evolución. Con