All Posts


A cup of dark roast coffee, sunrise porch time, fresh sheets, a garden tomato, the smell of a new book, a glass of red fireside.....These are a few of my favorite things. All so simple, yet they bring me so much joy. Henry David Thoreau author, naturalist, philosopher, was born


Have you ever tried to pass comma-delimited values to SAS macro or to a SAS macro function? How can SAS distinguish commas separating parameters or arguments from commas separating parts of the values? Passing comma-delimited value as an argument to a SAS macro function Let’s say you want to extract


Organisations across the globe are caught in the midst of a digital revolution – one that has sent shockwaves rippling through every industry. Business leaders recognise the scale and pace of change: 68 per cent of executives surveyed by Accenture say that they expect their industry to be significantly disrupted


In the SAS/IML language, a matrix contains data of one type: numeric or character. If you want to create a SAS data set that contains mixed-type data (numeric and character), SAS/IML 15.1 provides support to write multiple matrices to a data set by using a single statement. Specifically, the CREATE


“Sharon” is overwhelmed by caring for her parents: both of their caregiving needs are increasing, she is weary from lack of sleep and fearful that her own health is in jeopardy. Her siblings live out of the area and seem unable to help. In addition to caring for her parents,
Last month I wrote a blog about sibling rivalry in caregiving which began with the following thoughts: 'As we are all well aware, providing caregiving for our parent(s) is complicated and messy. Siblings can often be both a blessing and a curse in this process, providing much needed relief and
As we are all well aware, providing caregiving for our parent(s) is complicated and messy. Siblings can often be both a blessing and a curse in this process, providing much needed relief and support, or perhaps creating additional stress and barriers to important decisions and resources. Why is this the


“They were the best of asteroids, they were the worst of asteroids.” ~ Charles Dickens Armstrong There are good asteroids, and there are bad asteroids. Good asteroids stay in their own neighborhoods and wait for us to come visit them. Bad asteroids, however, don’t wait for an invitation – they
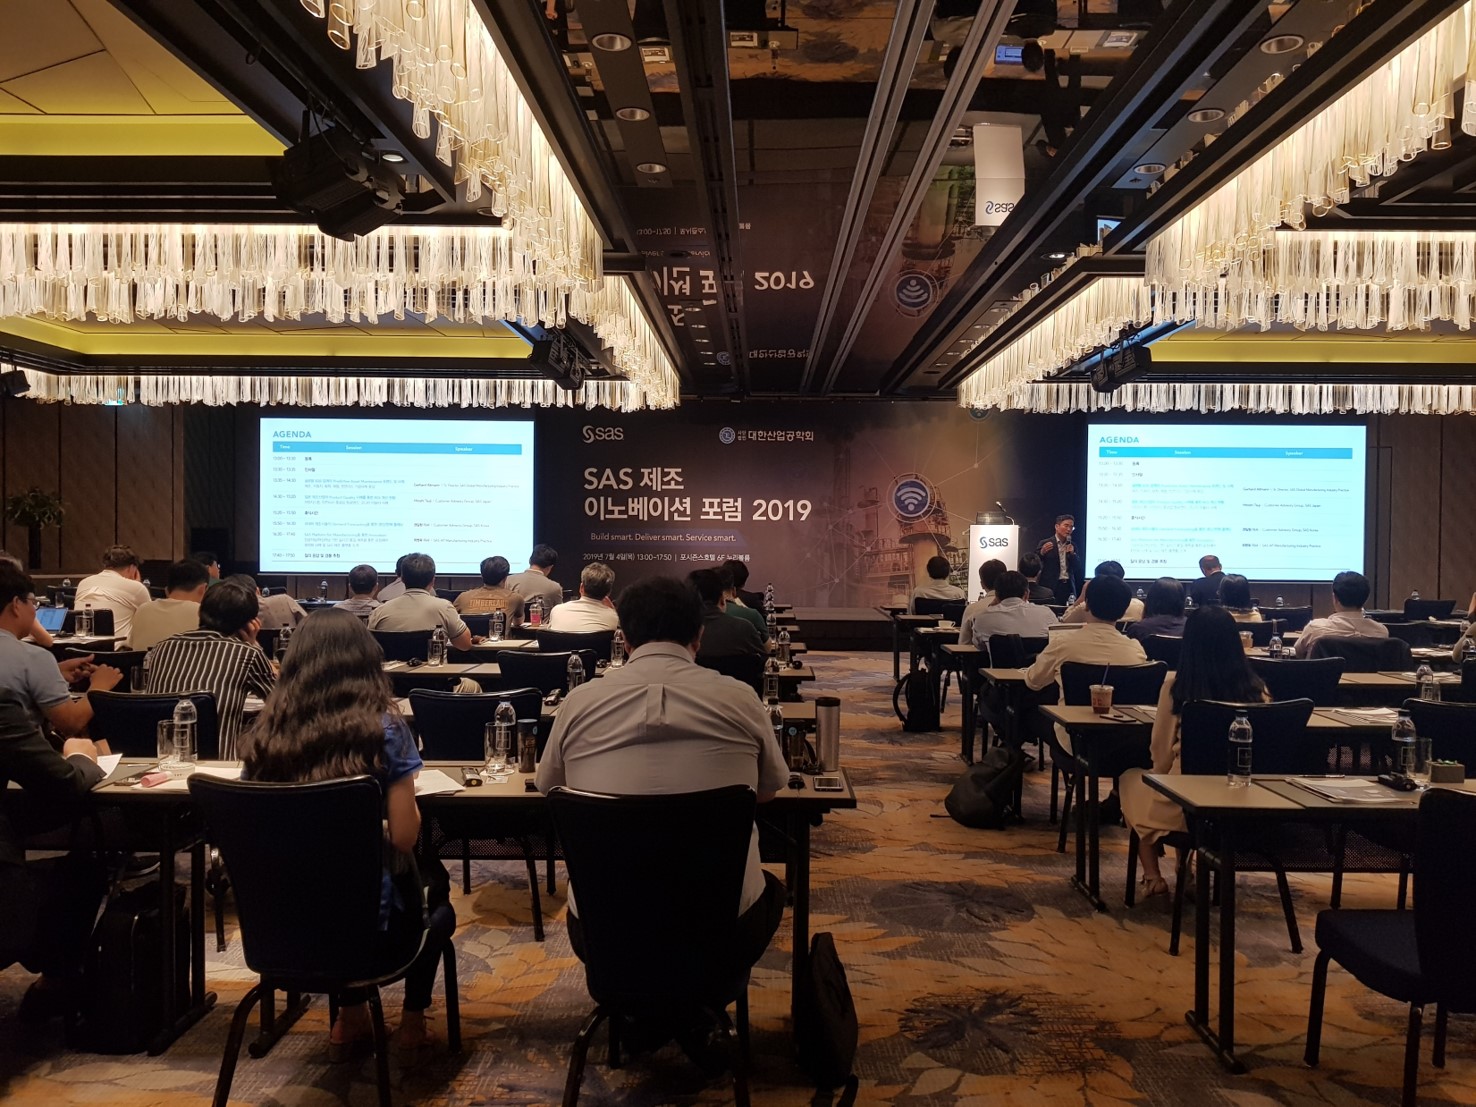

지난 7월 4일 SAS코리아는 광화문 포시즌스호텔에서 국내 제조 산업 관계자를 대상으로 ‘SAS 제조 이노베이션 포럼 2019(SAS Manufacturing Innovation Forum 2019)’을 성공적으로 개최했습니다. SAS는 이번 포럼에서 미국, 독일, 일본 및 국내 제조사들의 고객 사례를 통해 ▲글로벌 B2B 업계의 예측 자산 유지보수 ▲제품 품질 및 투자 수익(ROI) 개선 ▲수요 예측을 통한 생산/판매


A speaker at a recent major tech event quipped that “they will only call it AI until it is useful”. The point was that AI for the sake of AI is pointless, and can even be counter-productive. As soon as someone conceives and develops an actual use case, they name
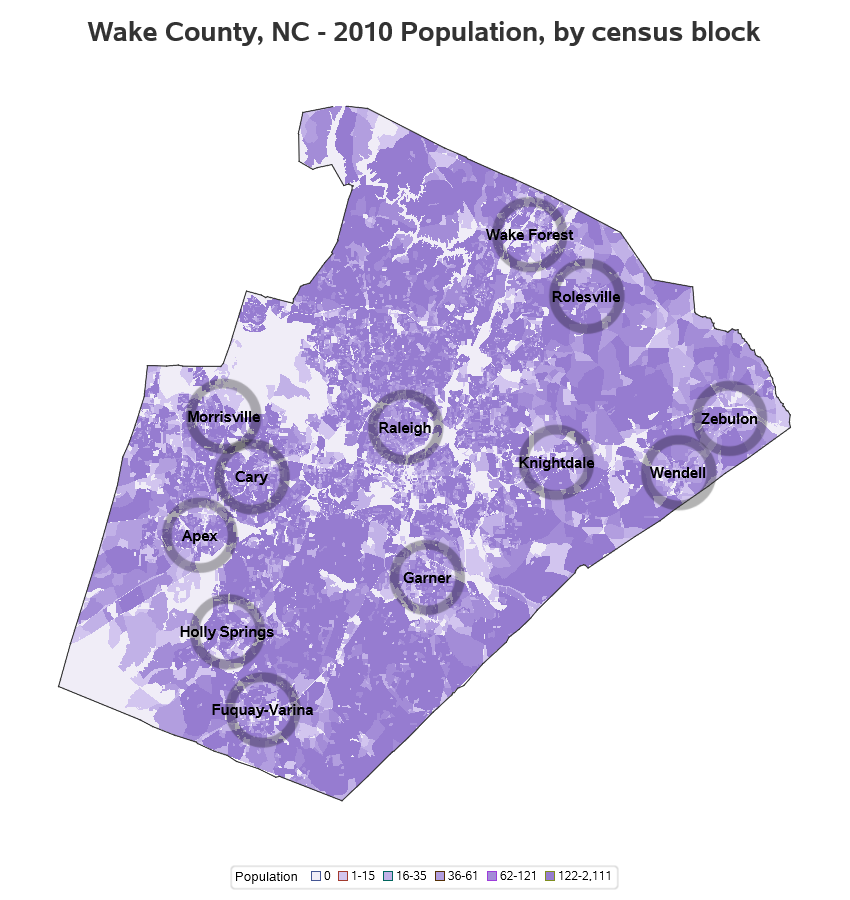

As the 2020 Census approaches, I'm getting my code ready to plot the data! And a question I often hear is "Can you use SAS software to plot data on a Census block map?" Rather than tell you 'yes', let me show you 'yes' :) Preparing the map First I

With all the excitement around SAS’ new software architecture, SAS Viya, we often get asked the question: What is it and how can it help my company conquer our analytics challenges? Fortunately, learning more about SAS Viya has never been easier. SAS Viya extends the SAS® Platform and provides reliable,


Here’s something you should know about Marvio Portela: He’s the kind of leader who’s not afraid to admit making a mistake. “I have had more than one life at SAS,” said Marvio, who explained that his first career at SAS began in 2010. “SAS is a place where you can


More and more business applications, including advanced analytics, are moving into the cloud. The advantages are obvious: agility, innovation and cost-efficient high performance. However, many cloud migrations fail to unlock its full potential. To maximize the performance and value of analytics in the cloud, companies need to balance options and
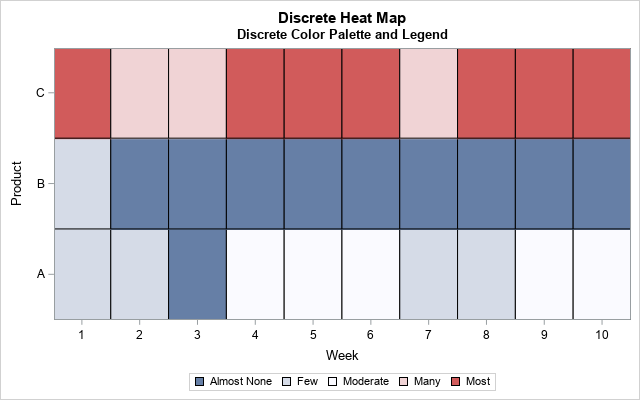
Heat maps have many uses. You can use a heat map to visualize correlation matrices, to visualize longitudinal data ("lasagna plots"), and to visualize counts in any two-dimensional table. As of SAS 9.4m3, you can create heat maps in SAS by using the HEATMAP and HEATMAPPARM statements in PROC SGPLOT.