All Posts


Technological advancements are changing every industry – and the health care industry is no exception. The value of AI has never been greater than when it’s used to improve patients’ conditions and save lives. For example, Cancer Center Amsterdam joined forces with SAS to improve patient care outcomes with AI.


Can you still hear it? The "D" word. For years it has been haunting conference keynotes and through clever and less clever books. The Axel Springer Group has made it. The German automobile manufacturers have not yet but are catching up. My CD player at home didn't survive – even


An informat helps you read data into a SAS data set. SAS supports more than 100 informats. The most common informats are related to dates and times and make it easy to read an input string such as 28JAN2001 and convert it to a SAS date such as 15003. Yet


One of my favorite parts of summer is a relaxing weekend by the pool. Summer is the time I get to finally catch up on my reading list, which has been building over the year. So, if expanding your knowledge is a goal of yours this summer, SAS Press has

At the end of this week, I’m heading to the beach for our annual extended-family beach trip. This has been a tradition for decades—well before I was born. Yes, which beach we go to has changed, the week we go has varied over the years, but we are committed to


O SAS prepara-se para mais uma edição do SAS Fórum Portugal, o maior evento nacional de Advanced Analytics, que se realiza no dia 4 de Julho, no Centro Cultural de Belém, em Lisboa. Desta vez, o evento terá um sabor especial, uma vez que coincide com o 25º Aniversário do
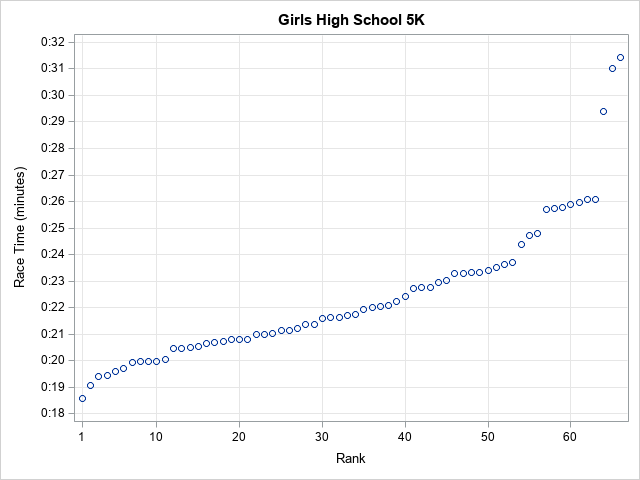
Math and statistics are everywhere, and I always rejoice when I spot a rather sophisticated statistical idea "in the wild." For example, I am always pleased when I see a graph that shows the distribution of race times in a typical race (such as a 5K), as shown to the


Did you know that social media can help you out with speaking at an event? Yes, even now, while you plan. What's more, it can be instrumental in maximizing your entire presenter experience before, during and after your presentation. Here are some ideas to get you thinking.
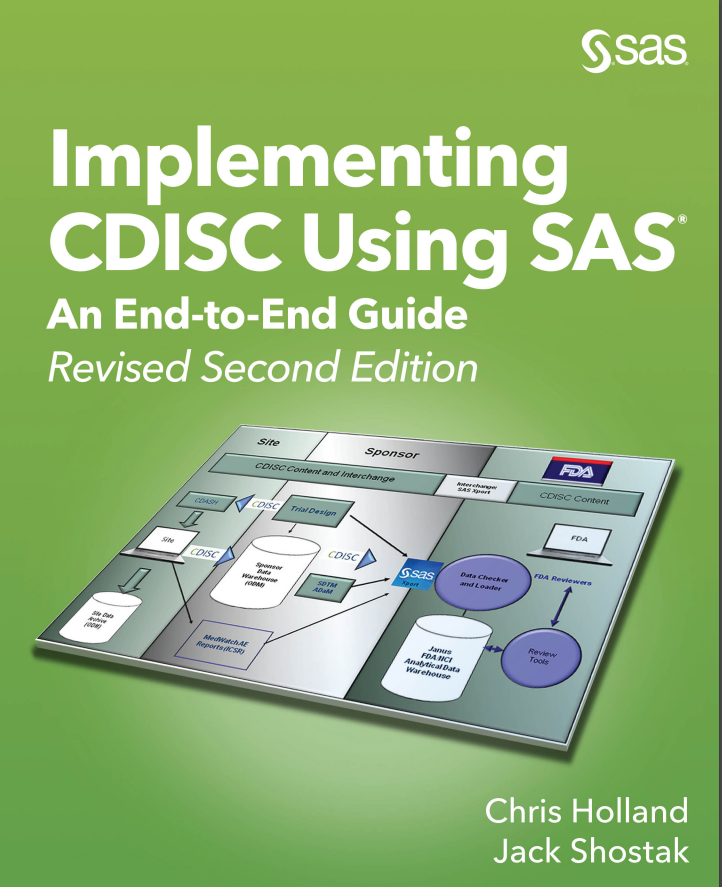

When Jack Shostak and I first started thinking about writing a SAS book on implementing CDISC (Clinical Data Interchange Standards Consortium) standards, we held one truth to be self-evident: that at least some parts of the book would be outdated before it was even published. Thanks to some lucky timing


La industria de las telecomunicaciones está evolucionando a un ritmo vertiginoso. Hablar de la telco del futuro en términos tecnológicos es muy complicado, pues es algo que está en constante movimiento. Pero al observar la historia de la industria y el estado de la tecnología de hoy, podemos obtener una
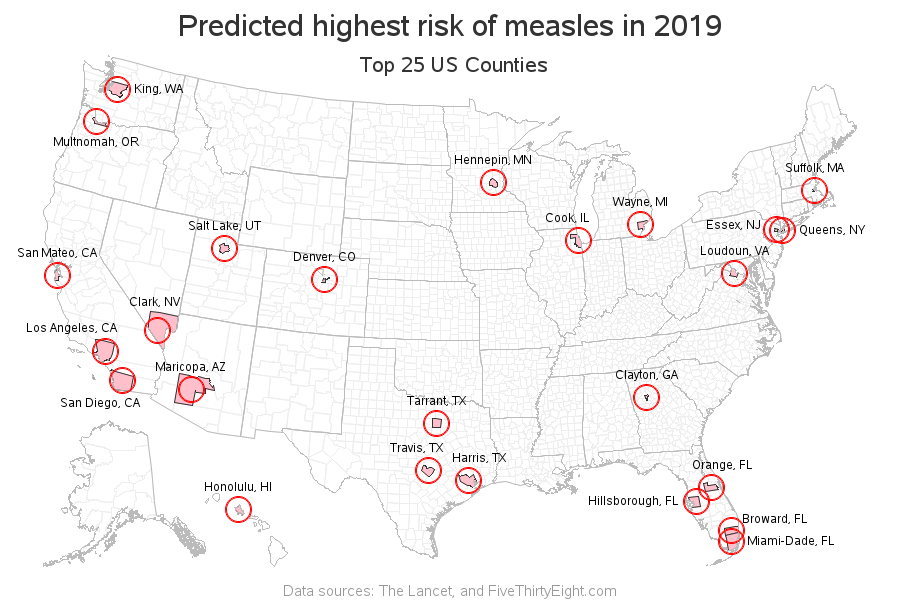

Cases of the measles have certainly been making headlines in the news recently. And with all the data at our disposal these days, it seems like we should be able to predict which areas in the US are most likely to have measles outbreaks, eh? A group of independent researchers


When it comes to meals, how often do you find yourself pressing the easy button? If you are on a first name basis with the fast food drive-through checkout person or if the frozen pizzas boxes are starting to pile up, keep reading.


"There's a way to do it better - find it." - Thomas A. Edison When it comes to SAS coding, this quote by Thomas A. Edison is my best advisor. Time permitting, I love finding better ways of implementing SAS code. But what code feature means “better” – brevity, clarity
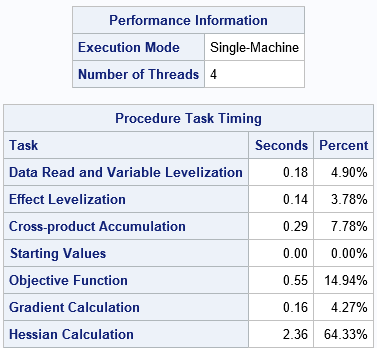
SAS/STAT software contains a number of so-called HP procedures for training and evaluating predictive models. ("HP" stands for "high performance.") A popular HP procedure is HPLOGISTIC, which enables you to fit logistic models on Big Data. A goal of the HP procedures is to fit models quickly. Inferential statistics such

In his article How to use CASL to develop and work with user-defined CAS actions, Brian Kinnebrew defines CASL as "a language specification used by the SAS client to interact with and provide easy access to Cloud Analytic Services (CAS). CASL is a statement-based scripting language with many uses and