All Posts


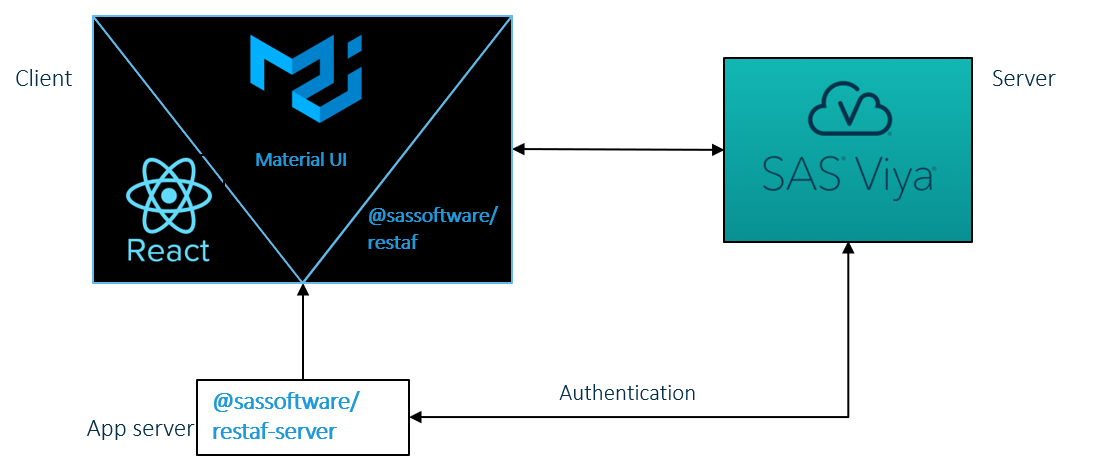
As a long-time SAS 9 programmer, I typically accomplish my data preparation tasks through some combination of the DATA Step, Proc SQL, Proc Transpose and some housekeeping procs like Proc Contents and Proc Datasets. With the introduction of SAS Viya, SAS released a new scripting language called CASL – a
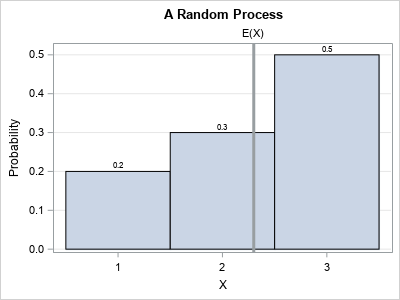

Books about statistics and machine learning often discuss the tradeoff between bias and variance for an estimator. These discussions are often motivated by a sophisticated predictive model such as a regression or a decision tree. But the basic idea can be seen in much simpler situations. This article presents a


Diversas urgencias laborales y personales hicieron que dejara de escribir este blog con mis humildes opiniones y aportes técnicos. Superadas las mismas, aquí estoy de regreso. No les diré que muuuuuuchos seguidores al estilo de Wos pidieron a gritos mi regreso, pero he de decirles que ante mi sorpresa varias
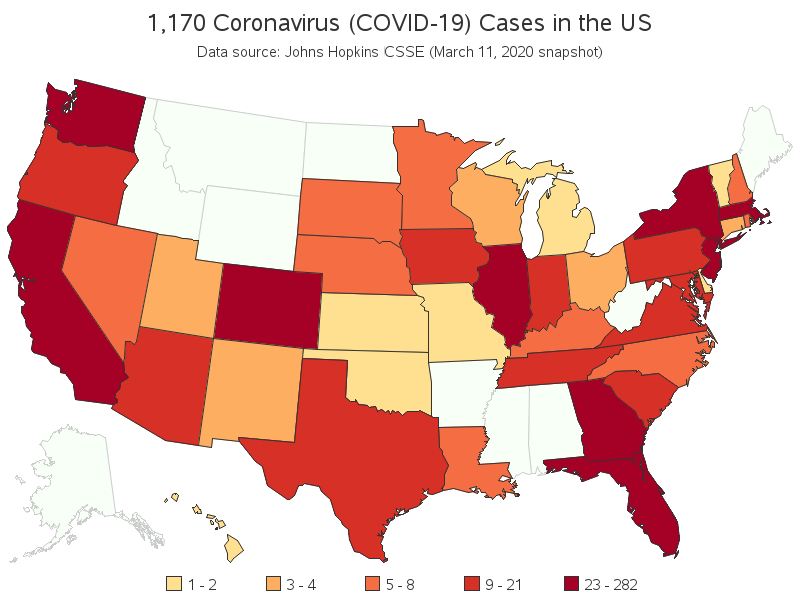

Everyone's thinking about the Coronavirus Disease 2019 (COVID-19), and wondering if there are any cases near where they live. I recently used SAS Software to create a dashboard with a world map showing which countries had reported cases. And now that the virus has spread around the world, a world/country-level


Hace algunas semanas les contábamos algunos de los secretos que están utilizando los grandes del retail en Latinoamérica para mejorar la planificación de la demanda. Lo hacíamos con base en ejemplos presentados durante el NRF 2020, para muchos el principal evento de innovación y tecnología aplicadas al sector retail o


Todos los negocios enfrentan desafíos de muy diferentes índoles, pero cuando nos referimos a aquellos que basan parte significativa de sus ingresos en el crédito - como los sectores financiero, telecomunicaciones y departamental o minorista-, éstos son los primeros en enfocar su atención y esfuerzo en alternativas creativas y hasta
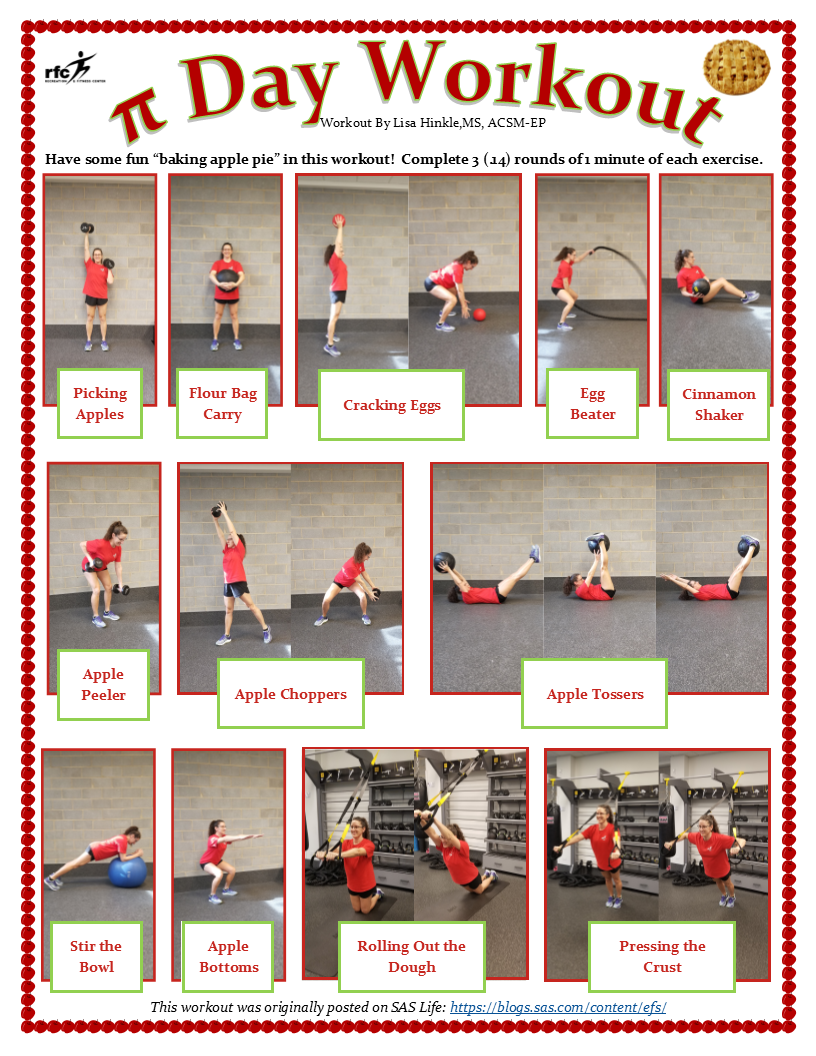

Join the Recreation & Fitness Center and have some fun celebrating #PiDay2020 by "baking apple pie" in this workout! Complete 3(.14) ;) rounds of 1 minute of each exercise. --> Please check with your physician before participating in any exercise program. Picking apples – Alternating Overhead Shoulder Press Flour Bag


Mit der Firma Sixt fing alles an. 2008 haben SMILE.AI eine Customer Experience Plattform für den Autoverleiher entwickelt.

Transforming into an analytics-powered company is the ambitious goal of many of today’s organisations. The key to success relies not only on the adoption of advanced technologies but mostly on people who are able to connect artificial intelligence to the business processes, taking advantage of algorithms, insights and automation. Among
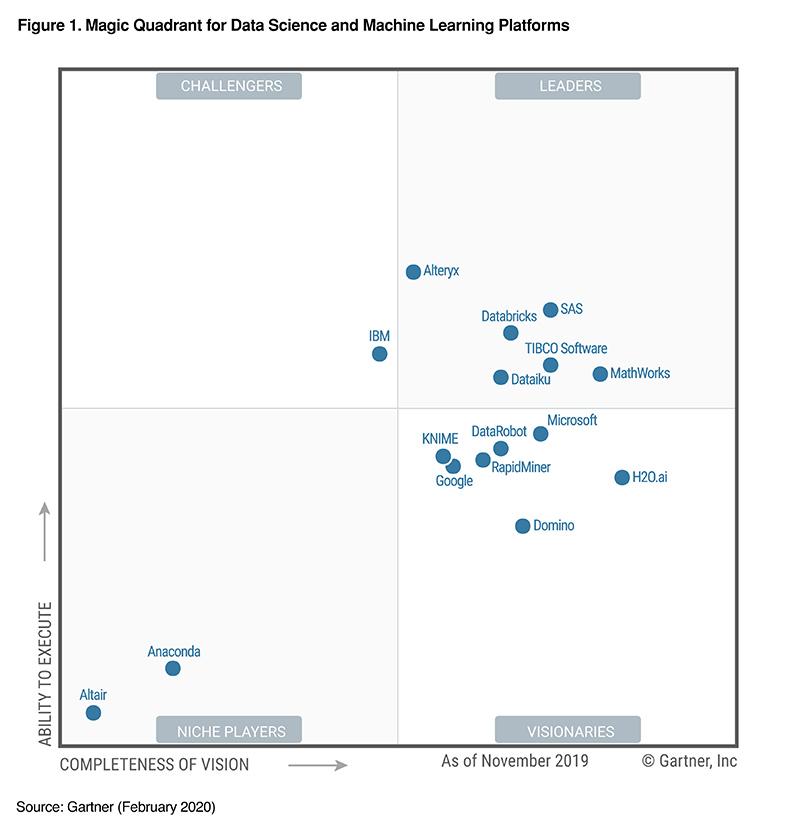

SAS가 최근 글로벌 시장조사기관 가트너에서 발표한 ‘2020 가트너 매직 쿼드런트: 데이터 사이언스 및 머신러닝 플랫폼(2020 Gartner Magic Quadrant for Data Science and Machine Learning Platforms)’ 보고서에서 비전 완성도 및 실행력을 인정받아 리더로 선정됐습니다. SAS는 해당 부문에서 유일하게 7년 연속 리더로 선정됐는데요! 작년 대비 괄목할 만한 성장을 보이며 최상위 리더 제품으로

Mathematical optimization can help business leaders make better decisions in every aspect of their business. After a model has been built, end users are usually interested in doing some sort of scenario analysis to test its robustness and visualizing key performance metrics. SAS has various products that can work with


As AVT expands into domain specific topics, the shape of the programme will evolve. I am looking forward to seeing what the next cohort of participants will choose to love about AVT.


Whether you are a regimented breakfast eater, a breakfast skipper or fall somewhere in between, we could all use some new ideas for breaking our overnight fast with something besides a pastry, a bowl of cereal or a bagel. All too often people grab what is most convenient during their
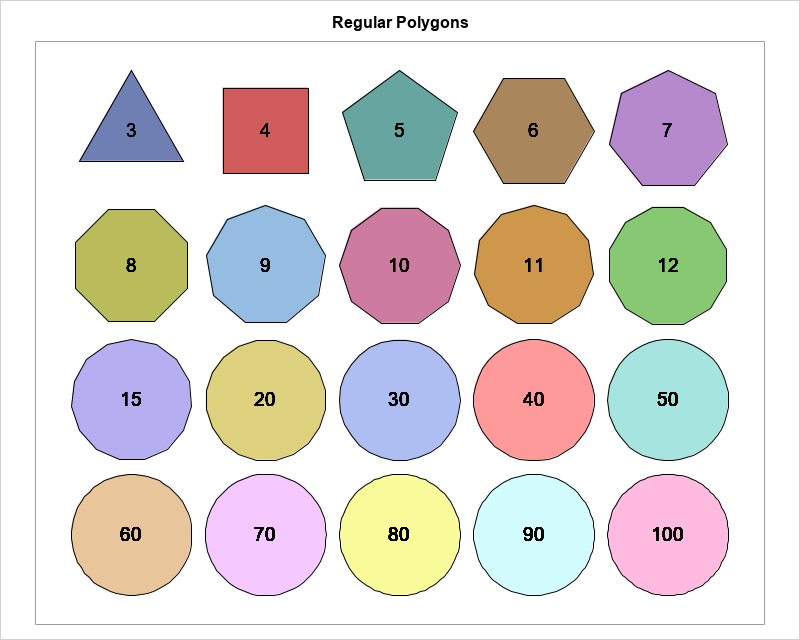
Recently, I saw a graphic on Twitter by @neilrkaye that showed the rapid convergence of a regular polygon to a circle as you increase the number of sides for the polygon. The author remarked that polygons that have 40 or more sides "all look like circles to me." That is,


SAS' Leonid Batkhan shows you how to automate creation of SAS variable labels so tables and reports are easier to read.