All Posts


Gespräch mit Mastercard, Vicepresident International Arne Pache.
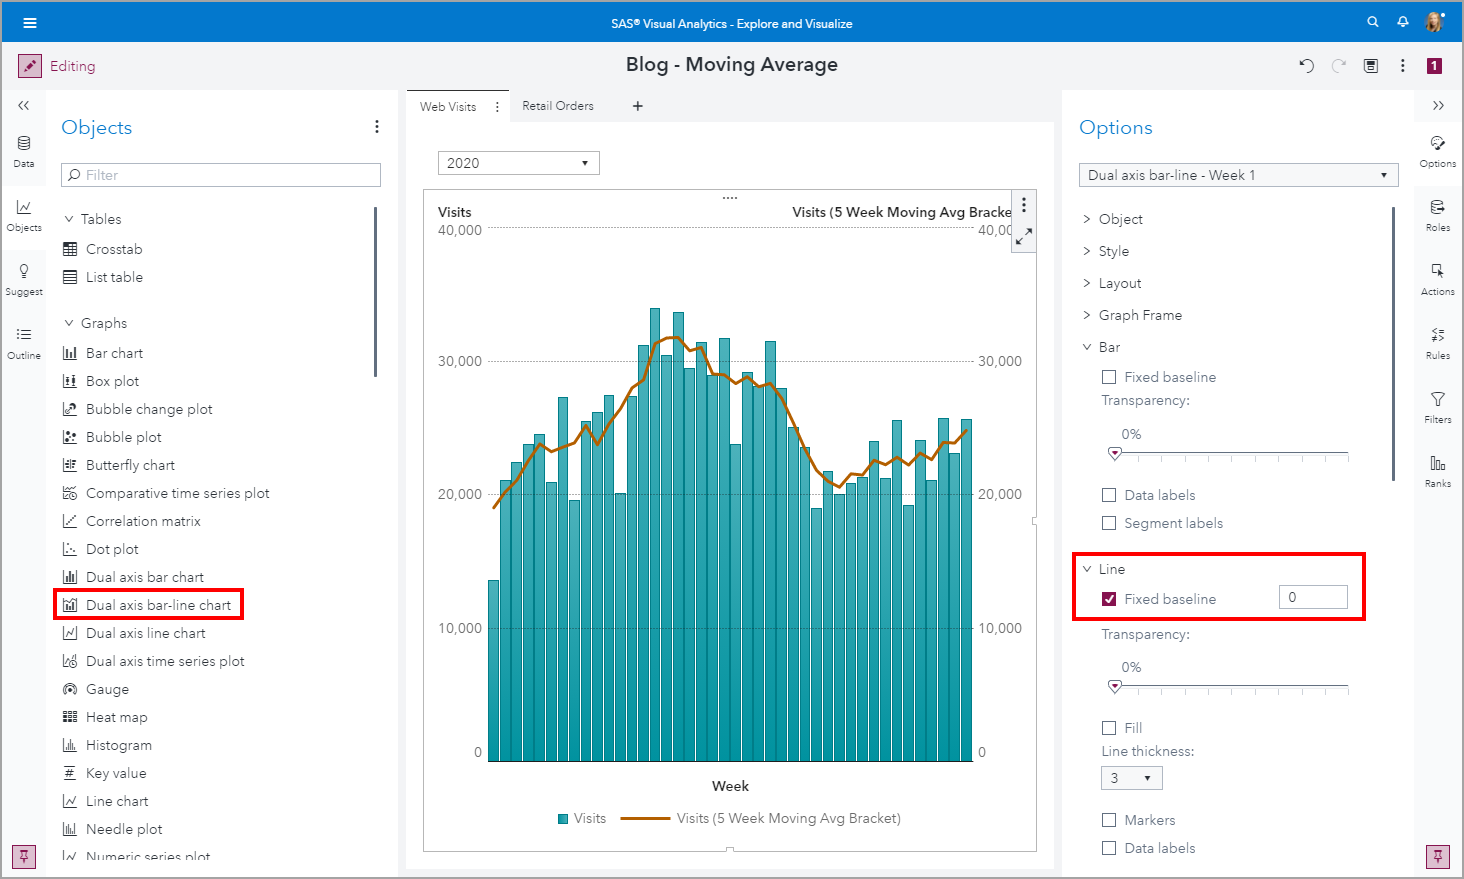

Data visualization has never been more widespread and consumed by a global audience as it has been this year with the Coronavirus pandemic. One visualization that is commonly used to display metrics of Coronavirus is a bar line chart where the bars display the actual values and the line is a moving average metric.


Today's blog is written by SAS pharmacist, Kristin Ellison Overall health is impacted by many variables; heredity, lifestyle habits, diet, stress, exercise, and sleep all play a role in your wellbeing. As you age, the likelihood of requiring medications to assist in your overall health increases. Taking multiple medications can


Nine months… that is how long some of us have been working from home with our spouse, managing the economic stress of the pandemic, homeschooling children, worrying about family members, social isolation and re-negotiating household roles. It is no wonder that people are wondering if their relationship will last. Whether
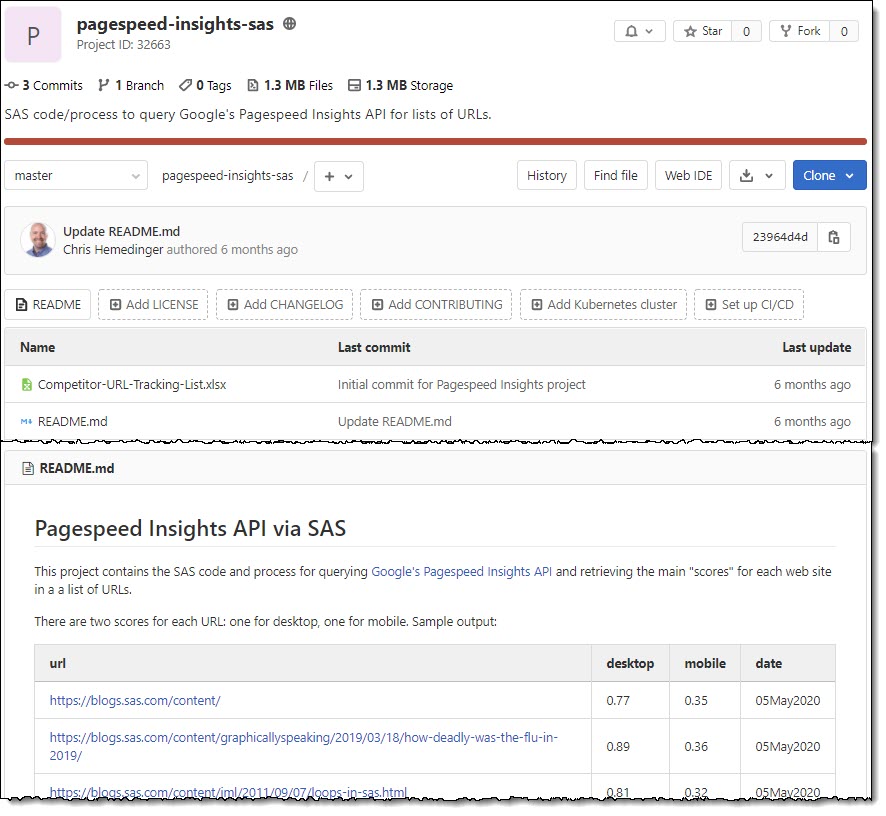

As you begin managing your SAS code and projects in Git, here are a few guidelines for how to organize your work and collaborate with others.
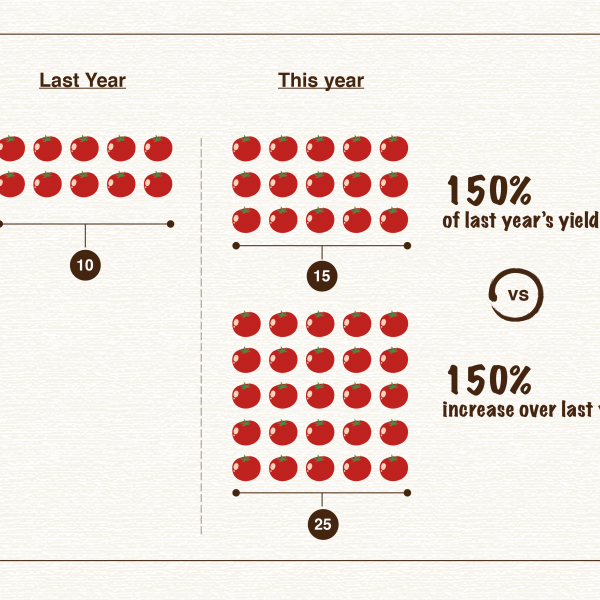

Editor's note: This blog post is part of a series of posts, originally published here by our partner News Literacy Project, exploring the role of data in understanding our world. “Numbers don’t lie” is a phrase we often hear to support the idea that something must be true if you can cite data or
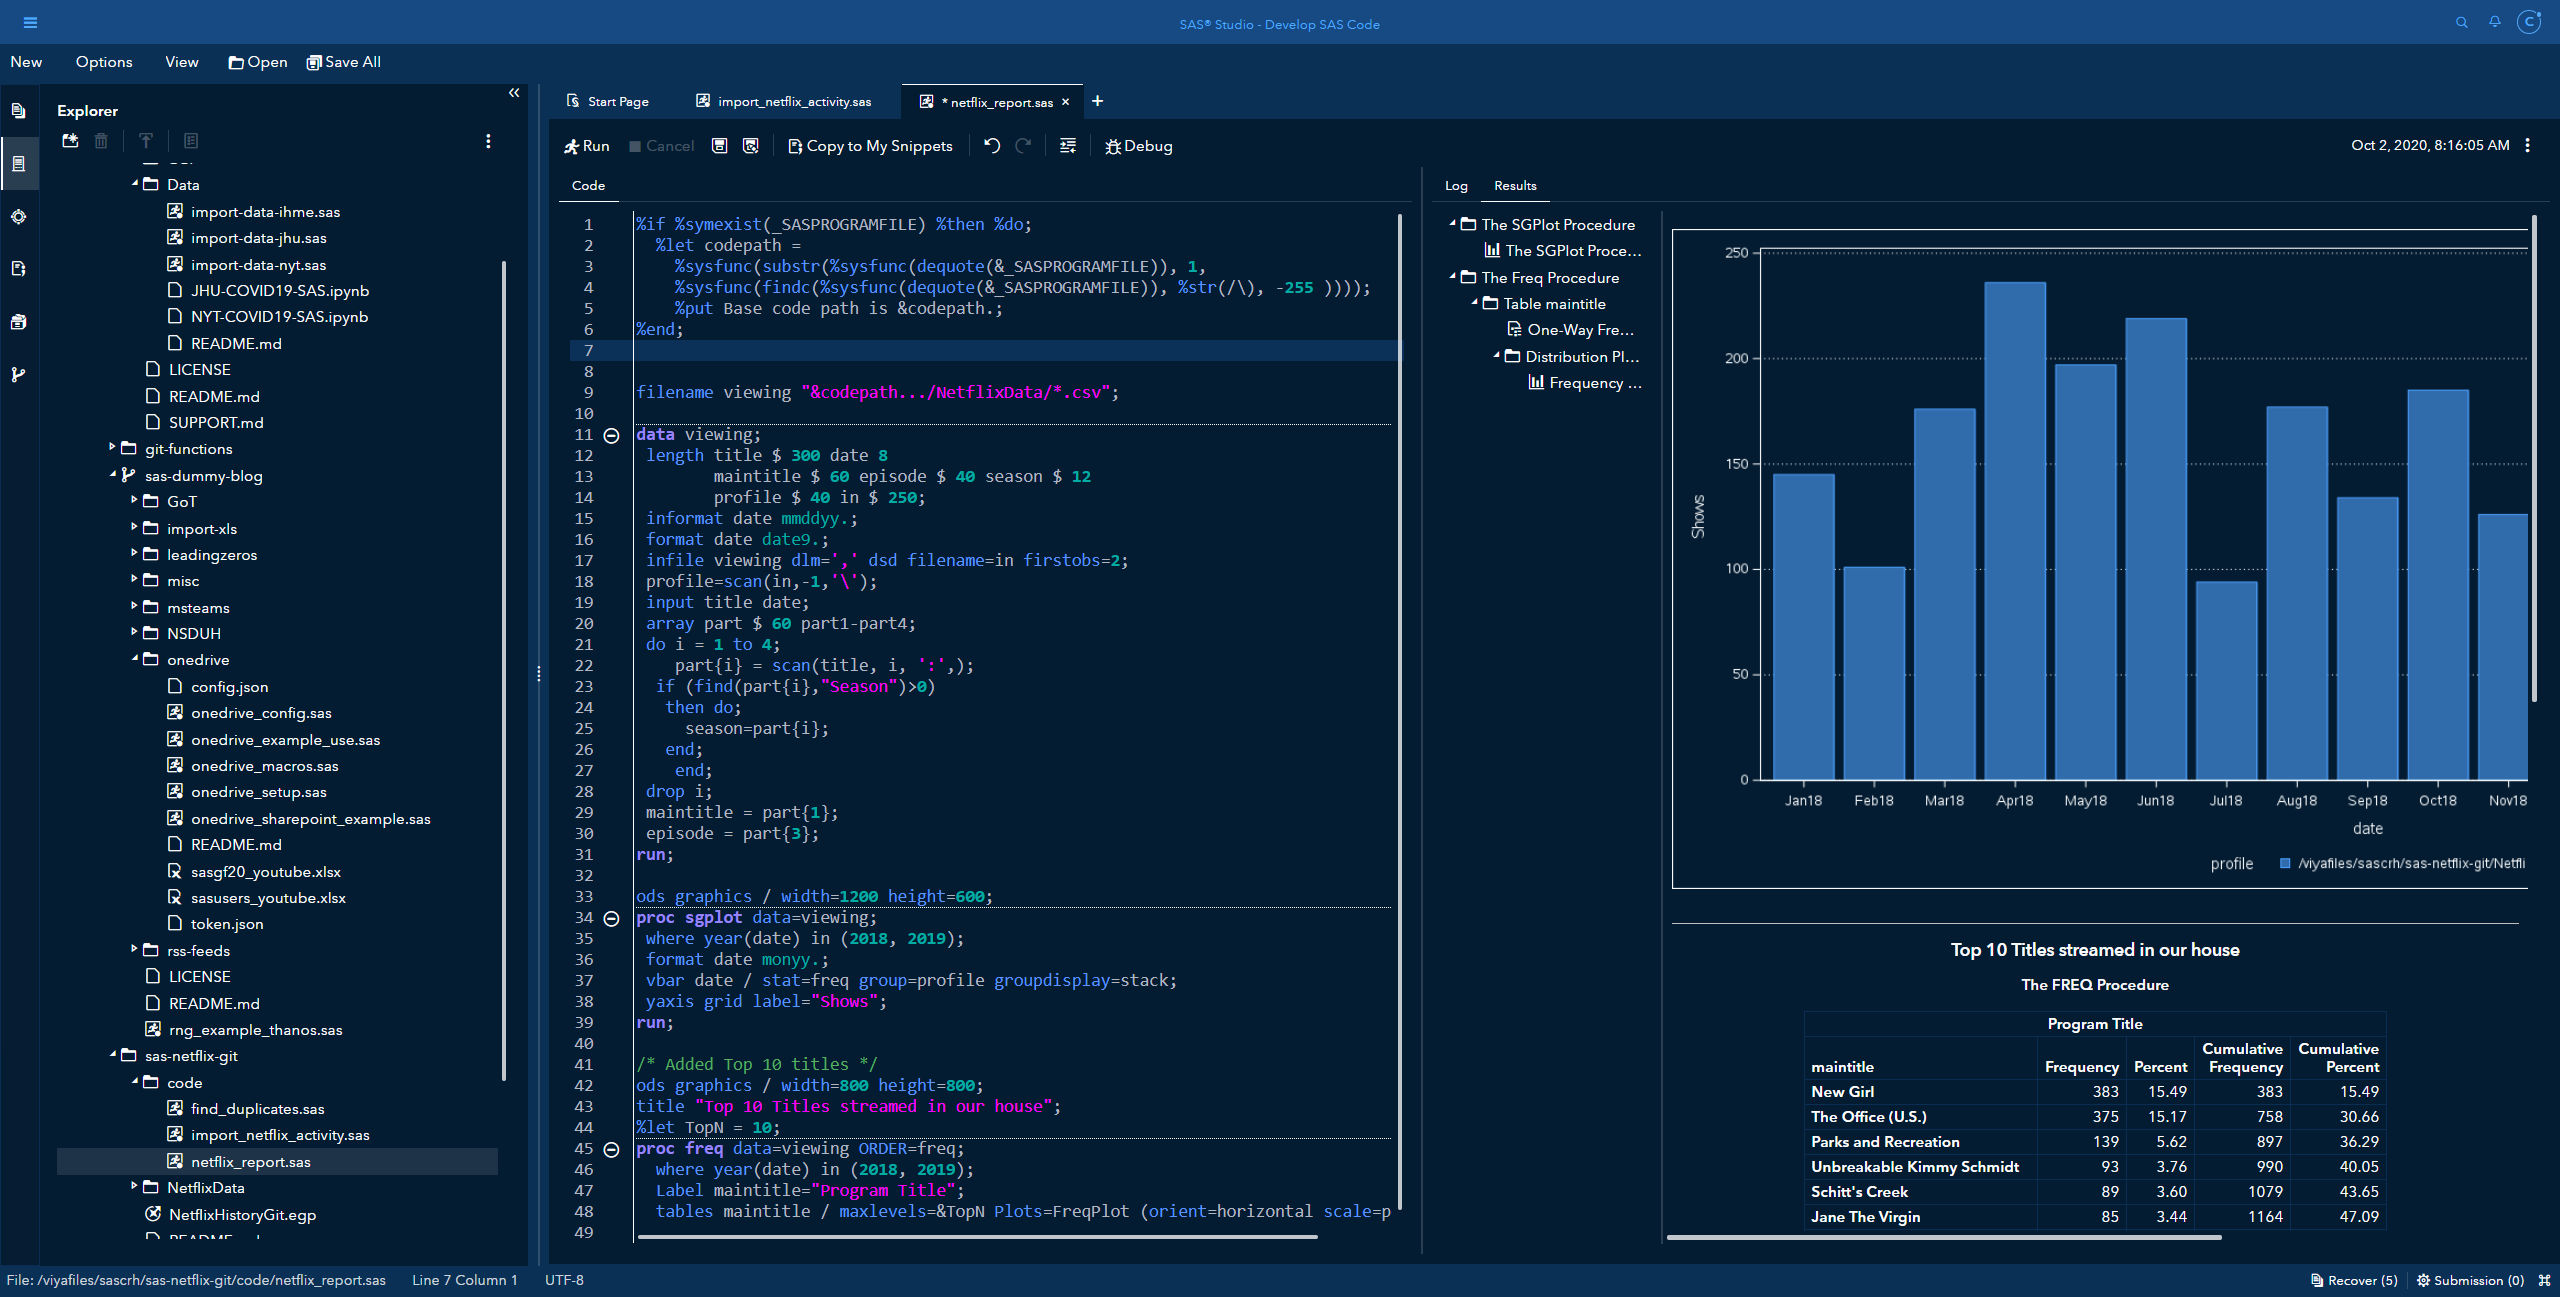

If you're a SAS Enterprise Guide user who is looking to move to SAS Studio, there is a lot to like about your new coding environment.


Where do your data scientists sit? Perhaps they occupy a typically gloomy, computer-filled basement. Or maybe they have a glassy building all to themselves. Either way, you’ll not always see business decision makers walking the same corridors. After all, analytics is best left to the experts, isn’t it? Yet back


A year ago we could not imagine stadiums being empty during the most exciting sports events, but it is a common sight now. The entertainment sector is one of the hardest hit sectors because of the COVID-19 pandemic [1]. Social distancing requirements made it impossible to have viewers in stadiums
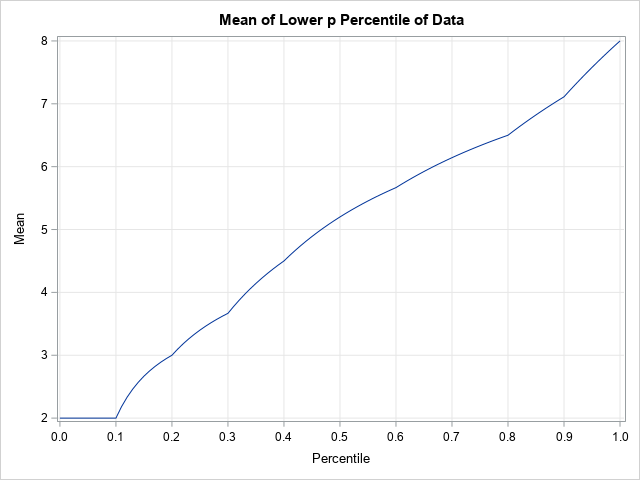

Intuitively, the skewness of a unimodal distribution indicates whether a distribution is symmetric or not. If the right tail has more mass than the left tail, the distribution is "right skewed." If the left tail has more mass, the distribution is "left skewed." Thus, estimating skewness requires some estimates about


Learn why integrating EHR data with pharmacy and claims data improves patient care.


The coronavirus pandemic has changed many things in many industries – and not always in the most obvious way. Insurance companies have seen both fewer claims and fewer sales. As a result, many have realised that the process of digitisation, often started slowly before lockdown, must now be accelerated. More,


Imagine driving in a foreign country at night with no GPS and half a tank of gas in the pouring rain. And you have to reach your destination before sunrise. That’s a little like how it felt when COVID-19 turned our 2020 plans upside down, and we raced into the


In my last blog post, I talked about the importance of establishing the right team for data science projects. Here, I’m going to talk about some of the barriers that can prevent successful adoption of data science. You can read my whole "data science in the wild" blog series here.
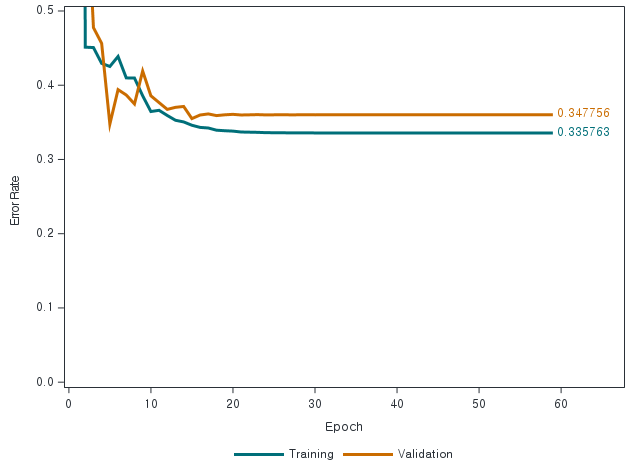
지난 딥러닝 시리즈에서는 SAS Visual Data Mining and Machine Learning을 활용한 딥 러닝 모델 생성에 대한 내용 중 <기본 심층 신경망(DNN) 모델 아키텍처와 배치 정규화를 사용한 DNN 모델 구축>에 대해 소개해 드렸습니다. 이번 시리즈에서는 딥 러닝 성능을 개선할 수 있는 하이퍼파라미터를 조정에 대해 소개해 드립니다. 일정 기간에 걸쳐 성능이 향상되고