(Image by ACC Digital Network @ YouTube)
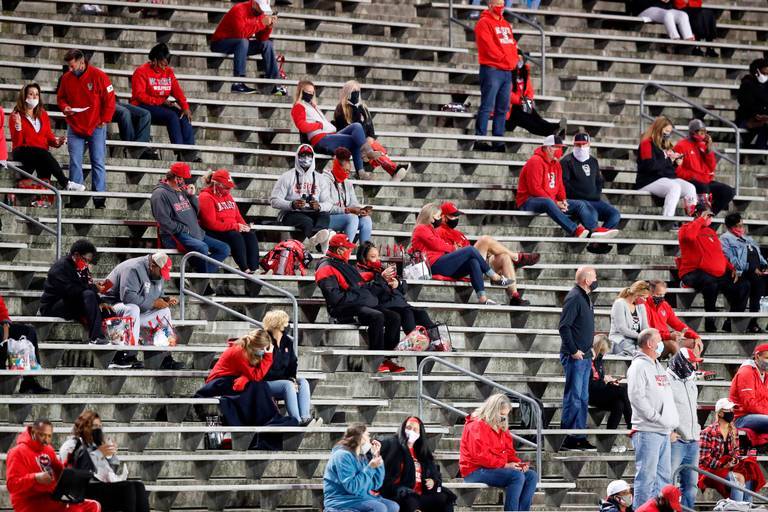
A year ago we could not imagine stadiums being empty during the most exciting sports events, but it is a common sight now. The entertainment sector is one of the hardest hit sectors because of the COVID-19 pandemic [1]. Social distancing requirements made it impossible to have viewers in stadiums and indoor venues.
The main discussion around venues started with the Champions League game (football/soccer) between Atalanta and Valencia on February 19th, an event that accelerated the spread of the pandemic in Italy [2]. The spread of the virus in Lombardy was quite noticeable, especially compared to the rest of the country. Extreme social distancing rules were implemented after this incident, preventing fans from being in the stands all over the world. Obviously, stadiums and event centers are some of the most difficult places to practice social distancing unless enough precautions are taken. Many leagues were either postponed or cancelled in April, even though most of the leagues eventually continued without fans despite the profit loss [3]. Countries are still trying to decide whether to have fans in venues, and the rules keep changing as number fluctuate. Belgium banned fans in March, allowed them in June, and banned them again in October because of increasing numbers of patients.
There is a growing uncertainty about the future of viewers in venues. Back in April, we had an internal discussion about the issue in our Sports Analytics discussion group when Brian Miles asked us a question. The question was whether we can utilize analytics and optimization to figure out how many people can be accepted into venues while adhering to social distancing. I quickly wrote an optimization model for a small section, and the result from that experiment holds true even after we eventually developed a full solution:
- With 6 feet social distancing restrictions, you can fill seated venues up to 30% utilization.
- If you want to allow people to have clear access to exits, it is between 11 to 15%.
This is the cold hard fact about venues right now. This number depends on the seat and section dimensions and also what kind of regulations you have, but the results we have seen so far are usually around this number. Our belief is that with all the financial troubles sports clubs are going through, if clubs are allowed to have fans in stadiums, then they should optimize it. You might think it is not a difficult problem to solve on the surface, but it gets complicated when details are added:
- Whether to accept people as individuals or as groups
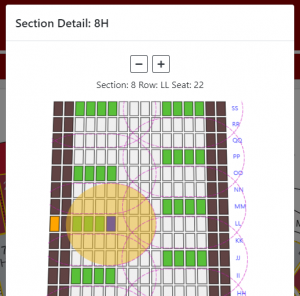
- Restrictions on seats that are close to the stairs and exits
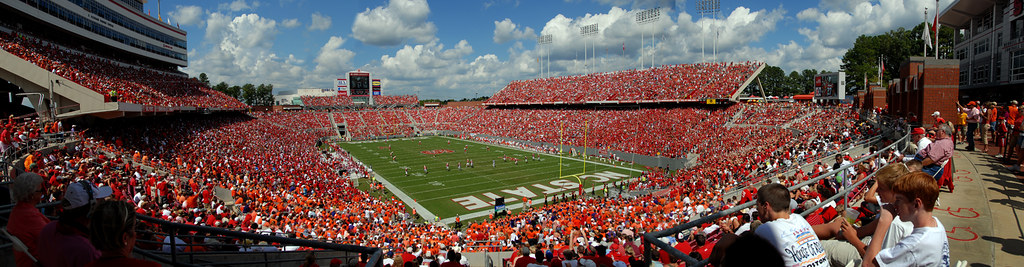
- Different rules for section places; for example, NC State University (NCSU) has student sections at the end zones
- Expected demand for various group sizes
- Maximizing number of people may not be equivalent to maximizing the revenue
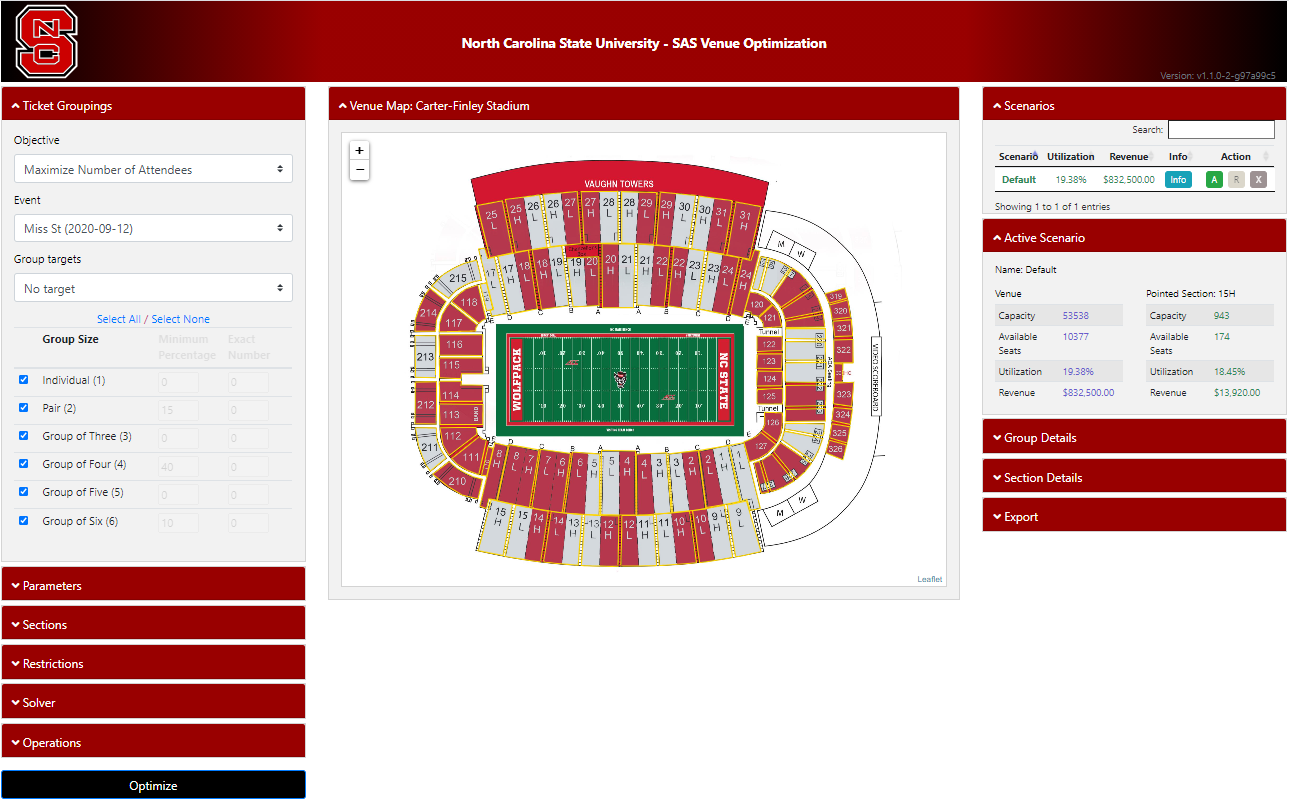
Because of the difficult nature of the problem, we collaborated with NCSU to build plans for their Carter-Finley Stadium.
Ticket sales are complicated by nature, but there are more aspects to consider during this pandemic: If fans can buy any ticket they want in the venue (and can have any number of people in their group as they want), it will lead to results that are far from the optimal values. The one question that every venue manager should answer is this: "How can I maximize my revenue (or fans in stands) under ever-changing COIVD-19 restrictions?" More than anything, venues need a way to build seating plans in an automated way.
Enter SAS Venue Optimization.
Group Selections
SAS Venue Optimization is powered by SAS Optimization under the hood. I will show how we built the optimization model below.
Let me start with a simple problem: consider a section with 2 rows and 5 seats in each row.
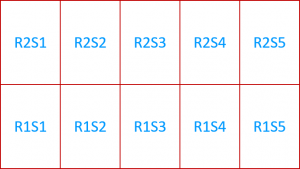
The total number of different groups we can sell in this small section is astonishing: there are 30 different configurations. In each row you can sell:
- 5 individual seats (S1, S2, S3, S4, S5)
- 4 groups of pairs (S1-S2, S2-S3, S3-S4, S4-S5)
- 3 groups of triplets (S1-S2-S3, S2-S3-S4, S3-S4-S5)
- 2 groups of 4 (S1-S2-S3-S4, S2-S3-S4-S5)
- 1 group of 5 (S1-S2-S3-S4-S5)
In total, we have 5+4+3+2+1=15 configurations per row, 30 in total.
Assume that the social distancing limit is equal to twice the width of a seat and depth of one row. The optimal strategy for this small section is clear; we can sell either the entire first row or the entire second row. A suboptimal solution would be selling R1S1-R1S2 and R2S4-R2S5. Consider this: North Carolina State University's Carter-Finley stadium has over 65,000 seats, and the total number of configurations is over 268,000. The question you need to answer is this: "Which one of these 268,000 groups should I choose?" For each group you can either sell or block: There are combinations.
Of course the total combinations are much less than this number; we cannot really sell S1-S2 and S1-S2-S3 at the same time. Because of social distancing, we cannot sell the following combinations either:
- S1-S2 and S3-S4
- S1-S2 and S4-S5
- R1S1 and R2S1
- R1S1 and R2S2
The problem boils down to finding all these combinations you cannot sell at the same time and choosing the ones that maximize your objective.
Let set be the set of all possible groups in the section, let
be the distance parameter between each pair of groups, and let
be the social distancing limit. We can define the set
of conflicting pairs of groups as follows:
Using conflicting pairs, we can write the optimization model as follows, where is the number of people in group
and
is a binary decision variable that indicates whether group
is selected:
The objective (1) is to maximize the total number of people. The conflict constraint (2) prevents selecting both groups in a conflicting pair. Constraint (3) forces to be binary.
The major challenge with this formulation is that there are too many conflicting pairs. We can strengthen the formulation by finding maximal cliques. This is where the network solver comes into play. Using the network solver, we can generate the set of maximal cliques such that at most one group in each clique can be selected. For
, let
be the groups that appear in clique
. Then we can call the mixed integer linear optimization solver to choose which groups to sell, in order to maximize the objective:
The clique constraint (4) enforces selection of at most one group per clique.
This intermediate operation to find maximal cliques reduces the optimization time roughly 60x.
Venue-wide Restrictions
We call this optimization model through the SAS Optimization Python interface, namely the runOptmodel CAS action. This action has a nice feature called "groupBy" that can split tables into groups at run time. By using it, we are able to run scenarios for all 82 sections of NCSU's Carter-Finley Stadium in parallel.
NCSU came up with a challenging question: What if there is a lower limit on the number of people for a certain group type? Consider that the forecasted demand for groups of 2 is 500. So the solution should have at least 500 groups of 2 to meet this demand. For this purpose, we split the problem into two parts. In the first part, we find all cliques in each section separately and in parallel. Then we combine all these cliques into a single optimization problem and use the DECOMP algorithm which uses decomposition to exploit the decomposed structure of this combined instance.
You can find a simplified version of our optimization model in our GitHub repository.
Performance
As I mentioned, Carter-Finley has 268K group combinations. In our test server with 96 CPU cores, the problem is solved between 15 seconds and 7 minutes, depending on what kinds of constraints are active. Our original model was taking 30 minutes to solve before we used the maximal cliques, where most of time was being spent on writing the problem.
To solve a seating layout problem of this size, you need to use optimization or accept the fact that your solution is suboptimal at best. It is why having an optimization method is critical for venues.
SAS Venue Optimization
Once we were convinced that we can solve these problems efficiently, we started offering SAS Venue Optimization in a few ways. It can be deployed to the customer's existing Viya services, offered as SaaS, or offered as RaaS. I am really happy with two aspects of how this project turned out:
- SAS Viya and SAS Optimization provide a great Python interface to develop custom apps, and we were able to connect the pieces quite easily
- How everyone in our sports analytics channel worked on full cylinders in a cross-divisional team effort to come up with an offering that can help sports clubs and venues
We turned this idea into a product with impressive speed. If you would like to learn more, see our post on LinkedIn.
Flow
SAS Optimization is the biggest piece in this puzzle and does the heavy lifting to solve massive problem instances. The remainder of the tool is written in Python for the most part: initial data processing input, web server, parameter selection, optimization calls, and export utility are all in Python. We used Flask and Gunicorn to create a web application that is responsive and can work with multiple clients. The web application benefits from several JavaScript technologies, including Vue.js and Leaflet. We also used EventSource technology to give a visual feedback to the user about the progress of the optimization.
The application depends on a SAS Viya installation and can be deployed very quickly using a Docker container. Usually after spending a few days with customers to standardize their input data, we can deploy SAS Venue Optimization within 30 minutes.
Seating App
If you are planning to attend SAS Forum UK & Ireland, SAS Forum Nordics or Beyond Tomorrow by SAS CEMEA virtual events this November, there is a surprise for you!
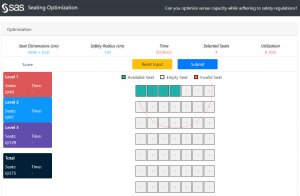
We prepared a smaller version of the venue optimization for an interactive corner. Here, you can try to beat SAS Venue Optimization to find (or get closer to) the optimal solution.
The app tells you if you are satisfying the social distance rule and how close you are to the optimal result when you submit your solution. You can see a sneak peek below:
 If you are attending any of these events, let me know about your experience! This was the first time I have built something like this, so I am especially curious. You can reach me here or on Twitter @sertalpbilal. I am looking forward to see how close you can get to the optimal!
As I have mentioned, a ready-to-use and simplified version of SAS Venue Optimization is in our GitHub repository.
References
[1] https://www.mckinsey.com/featured-insights/coronavirus-leading-through-the-crisis/charting-the-path-to-the-next-normal/covid-19-recovery-in-hardest-hit-sectors-could-take-more-than-5-years
[2] https://www.wsj.com/articles/the-soccer-match-that-kicked-off-italys-coronavirus-disaster-11585752012
[3] https://www.dw.com/en/coronavirus-sports-cancellations/a-52569936

5 Comments
Thanks for the information
This article is really amazing. Thanks for the sharing.
Pingback: What is optimization? And why it matters for your decisions - The SAS Data Science Blog
Pingback: Mathematical optimization at SAS - The SAS Data Science Blog
Pingback: Data or grass?: Combining a love for soccer with optimization - SAS Voices