All Posts
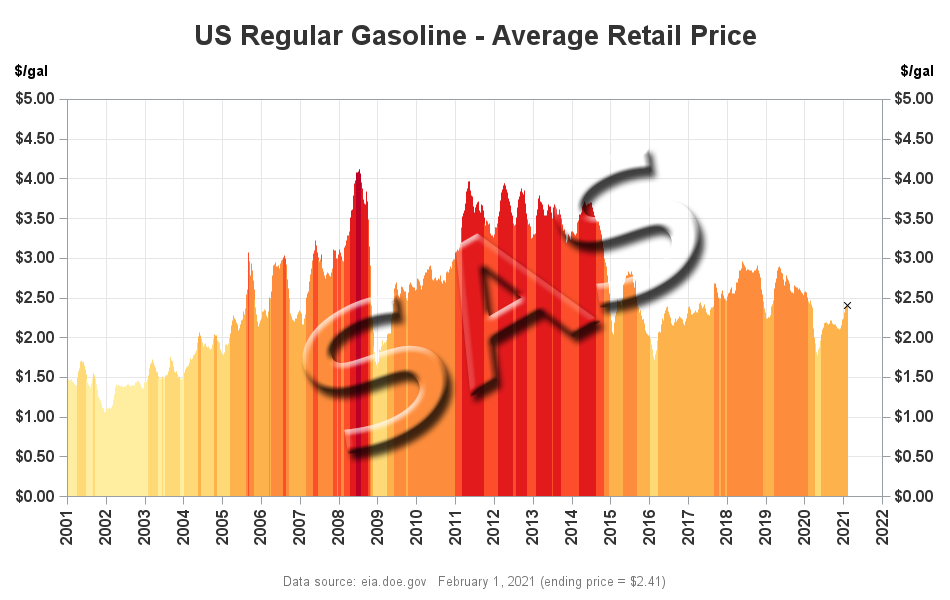

This is another in my series of blogs where I take a deep dive into converting a customized R graph into a SAS ODS Graphics graph. This time the example is a needle plot (that's essentially like a bar plot, with lots of tiny bars, plotted along a continuous xaxis).
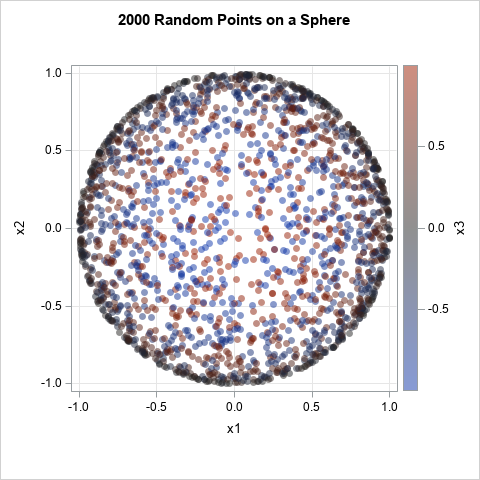

In a previous article, I showed how to generate random points uniformly inside a d-dimensional sphere. In that article, I stated the following fact: If Y is drawn from the uncorrelated multivariate normal distribution, then S = Y / ||Y|| has the uniform distribution on the unit sphere. I was


In my position as an independent customer experience expert on the SAS Collaborators Programme, I’ve been delving into the detailed results and findings from its latest piece of CX research: Experience 2030: Has COVID-19 Created a New Kind of Customer? The exercise set out to discover how attitudes have changed,


Globus (Rouven Dörr) and DFKI (Frederic Kerber) tackle the big questions about the future of AI in supermarkets.


I previously blogged about the impact drafting offensive linemen has on winning and making the playoffs. Since I wrote that, we have new data points to add to the analysis and an exciting finale to this NFL season. In this blog post, I’ll explore a few more arguments both in

SAS Press author Kim Chantala shows you how to to spend less time preparing data so you can lavish time on analysis.
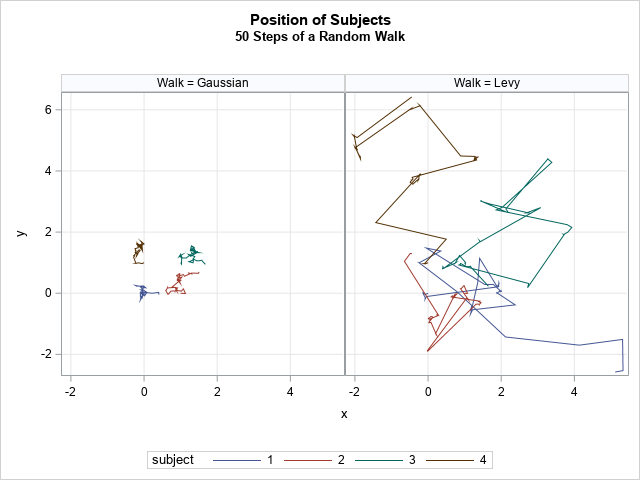
Imagine an animal that is searching for food in a vast environment where food is scarce. If no prey is nearby, the animal's senses (such as smell and sight) are useless. In that case, a reasonable search strategy is a random walk. The animal can choose a random direction, walk/swim/fly


The BIG Group can’t wait to gather in-person again, but for now, they’re staying safe and meeting virtually. We love this group portrait above of the Black Initiatives Group leadership council titled “An Evening of Excellence,” created by BIG co-chair Christopher Williams. __________________________________________________________________________________________ Our SAS culture blends our different backgrounds,

In conversation with Sophie Achermann, co-founder of the platform www.StophateSpeech.ch.

In the past, Sanjay showed how to create several basic graphs using both R and SAS ODS Graphics code. I'm going to take a bit of a "deeper dive" and focus a series of blog posts on highly customized graphs. Hopefully the code for these customizations will provide you with


Economic, tech and regulatory trends are shifting asset liability management strategies.

We’re proud of our unique company culture that spans across offices, divisions and geographies. It’s one of the reasons why SAS is named among the top workplaces in the world by Fortune’s Great Place to Work! If you’re curious about what it’s like to work at SAS, you’re in the right place. Our people are always asking, “What if?’ and pushing the bounds of


Stu Bradley evaluates his 2020 predictions for fraud, AML compliance and security.
Im Talk mit Sophie Achermann, Co-Founderin der Plattform www.StophateSpeech.ch


Little Miss Muffet Sat on a tuffet, Eating her curds and whey; Along came a spider, Who sat down beside her And frightened Miss Muffet away! I grew up chanting this popular nursery rhyme and now recite it to my children, but it wasn’t until I started making Greek