All Posts


La transformación digital es un fenómeno tecnológico y de negocio que continúa con una fuerte inercia dentro de las organizaciones de todas las industrias. Esta inercia ha sido impulsada de forma importante durante la actual pandemia, y se prevé que permanezca como uno de los temas centrales en la agenda

Small and midsize (SMB) manufacturers are critical drivers of innovation and productivity, and agility often gives them a competitive advantage over larger organizations. But they have unique challenges compared to larger manufacturers who have the resources and capital to achieve greater economies of scale. To take advantage of their agility,
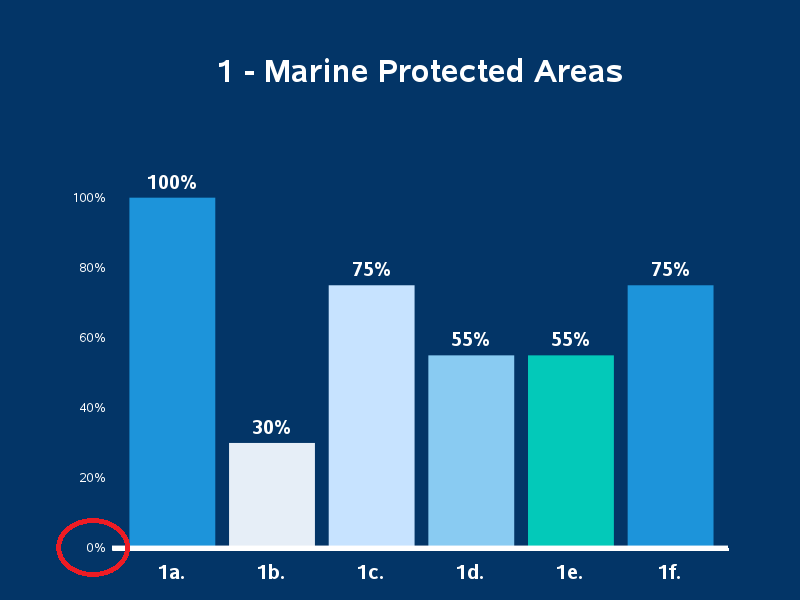

Having earned the Eagle Scout rank in Boy Scouts, I am of course very conservation-minded, and against polluting. I'm also an avid boat paddler and fisherman, and therefore I'm especially concerned about pollution in our rivers, lakes, and oceans. I even volunteered for a week to help survey coral reefs
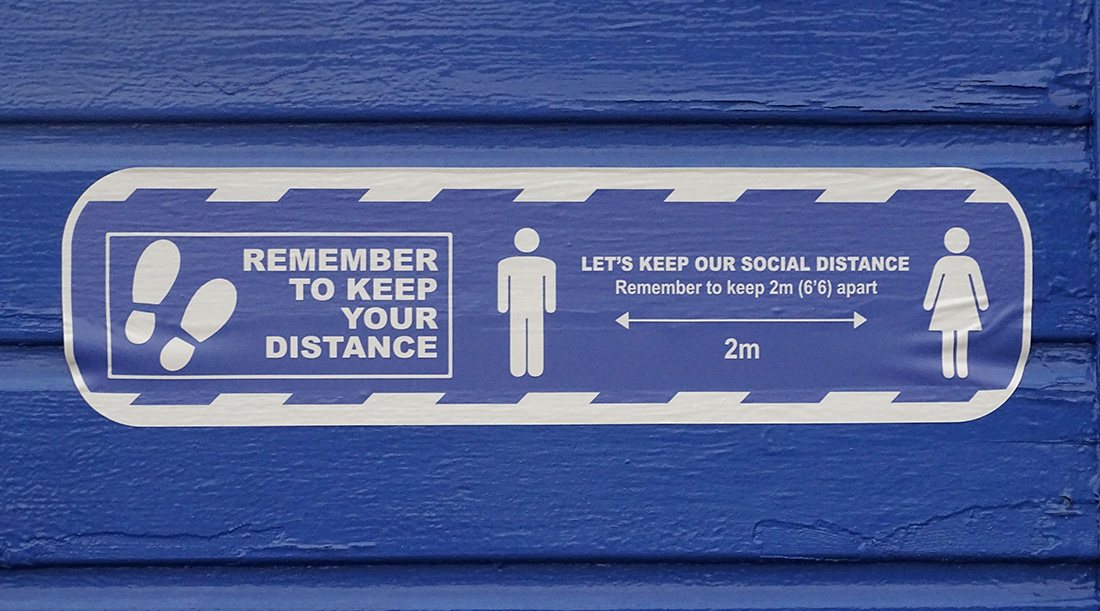

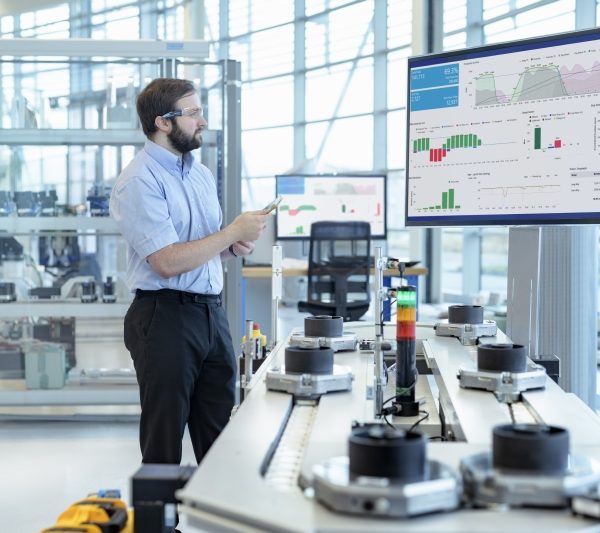
Learn how a computer vision application makes it safer, post-pandemic, for employees to return to factories.
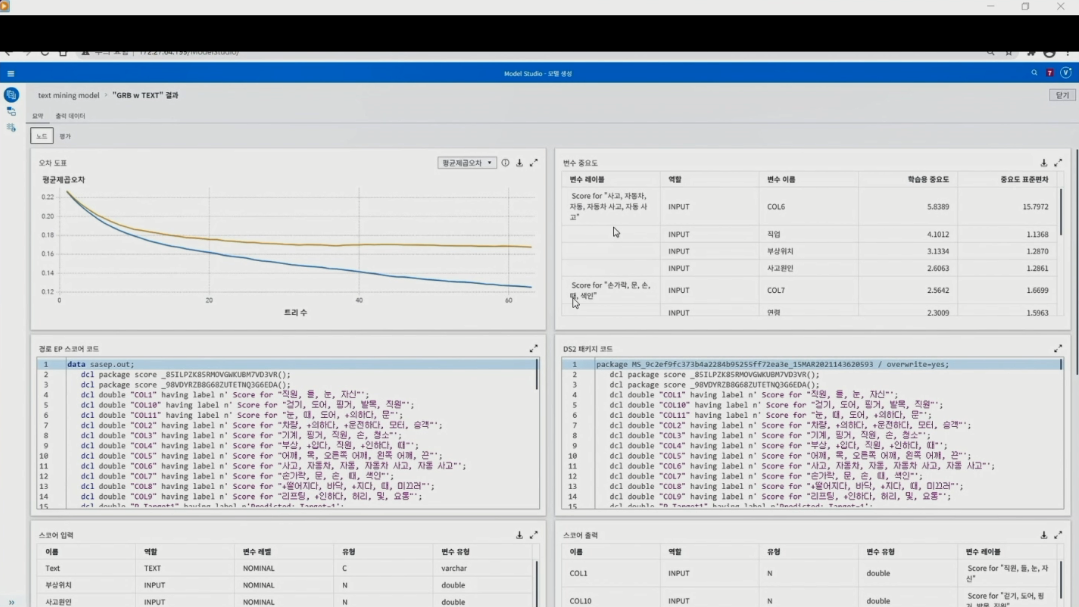

최근 화두가 되는 빅데이터와 머신 러닝은 예측 모델의 성능을 올리기 위한 방안으로 시작된 것입니다. SAS VDMML(Visual Data Mining and Machine Learning)은 예측 모델 개발 시 텍스트 데이터를 이용하여 모델의 성능을 높여주는 텍스트 분석 툴로, 비즈니스 사용자와 데이터 사이언티스트, 예측 모델 개발자 모두가 활용할 수 있습니다. 텍스트 분석은 자연어 처리 과정이


Red light therapy (RLT) is pretty amazing! Although it may seem like a new technology in recent years due to more mainstream articles, it’s not. I’ve been using it for a couple of years and have found it beneficial on many levels. Over 25 years ago astronauts discovered that red
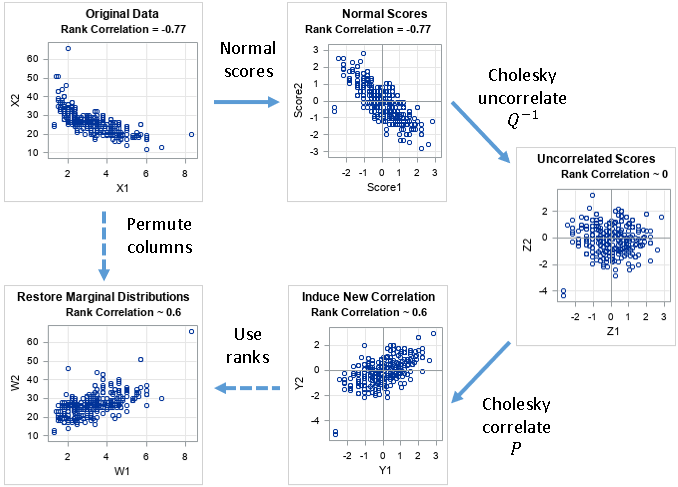

A previous article showed how to simulate multivariate correlated data by using the Iman-Conover transformation (Iman and Conover, 1982). The transformation preserves the marginal distributions of the original data but permutes the values (columnwise) to induce a new correlation among the variables. When I first read about the Iman-Conover transformation,

최근 마케팅에서 가장 중요한 이슈는 AI와 디지털, 고객 여정입니다. 이 모든 것은 ‘개인화 마케팅을 통한 고객 경험의 최적화’라는 마케팅의 궁극적 목표와 맞닿아 있습니다. 고객 경험 최적화를 위한 SAS의 전략과 솔루션을 소개합니다. 고객 여정 최적화를 위한 SAS의 비전과 로드맵 SAS의 비즈니스 솔루션인 SAS Customer Intelligence 360는 전사적인 마케팅 플랫폼입니다. 2004년 SAS


SAS' Leonid Batkhan presents an implementation of parallel processing by spawning multiple SAS sessions using SYSTASK statements with subsequent synchronization.
Simulating univariate data is relatively easy. Simulating multivariate data is much harder. The main difficulty is to generate variables that have given univariate distributions but also are correlated with each other according to a specified correlation matrix. However, Iman and Conover (1982, "A distribution-free approach to inducing rank correlation among

모든 비즈니스 영역으로 확대되는 텍스트 분석 그동안 소셜 미디어 분석에 국한되었던 텍스트 분석은 이제, 콜센터, 마케팅, 품질 영역으로 확장은 물론 최근 들어 전통적인 수작업 영역(발주처 요구사항 분석, AI기반 안전사고 예방 등)까지 확대하고 있습니다. 텍스트 분석을 하기 위해서는 텍스트와 함께, AI 기반의 NLP 머신러닝 엔진이 필수입니다. 이 엔진 내에서 문맥 기반의


En el pasado SAS Global Forum (#SASGF), Alex Kwiatkowski, Advisory Banking Consultant de SAS, y Thomas Zink, de IDC, lideraron una sesión titulada “Building a Better Bank” (Construyendo un mejor banco). Un resumen rápido de dicha sesión es que no importa el tamaño del mercado o la cantidad de usuarios que

SAS and Microsoft certifications can help with your professional and career development. And now, you can even take certification exams from the comfort of your own home.

사기 위험 증가, 그리고 고객 바로 알기 무수히 많은 고객 거래에서 사기를 찾는 일은 모래 속에서 바늘을 찾는 것과 같다고들 말합니다. 디지털 가속화로 휴대폰 하나만 있으면 언제 어디서든 원하는 서비스를 이용하고 비용을 지불하는 편리한 시대를 살고 있는 지금, 기업과 기관은 고객에게 보다 빠르고 더 많은 편의를 제공하여 시장과 고객을 뺏기지


Para fechar o Insurance Summit 2021, o evento contou com uma mesa-redonda com a presença de executivos do setor. Participaram Fabio Morita, CDO da Porto Seguro; Alexandre Putini, diretor de transformação digital da SulAmerica, e Denise Ciavatta, CIO da HDI Seguros, para debater temas como transformação digital, inovação aberta, tendências