All Posts


Em palestra no Telco Summit 2021, Fabrício Bindi, diretor de AI e Customer Insights da Vivo, falou sobre a importância da aproximação da marca com o cliente por meio da digitalização e os resultados no uso do analytics nos processos da organização. O executivo falou sobre alguns casos de uso,


We need, in other words, to democratise analytics in the true sense of the word, by making them accessible to everyone.


Tras la reciente aprobación de la regulación europea del uso de la inteligencia artificial, hemos observado cómo cobra fuerza el concepto de explainable AI o inteligencia artificial explicable. ¿En qué consiste exactamente? Su objetivo pasa por garantizar que las interacciones de los usuarios con los modelos en los que se


In 2012, Data Scientist was dubbed the sexiest job of the 21st century by Harvard Business Review and it is one of the most in-high demand jobs in the world. Data has become a key part of every organization as technology flourishes. As the world become increasingly digitized, businesses are


I am a long-time SAS 9 Administrator, I feel very confident in my understanding of SAS 9 administration. I will admit I don’t know everything, but I have been administering SAS since the days of SAS 9.1.3. I often tell my students I am a general practitioner when it comes

Vivemos num mundo cada vez mais digital e trabalhamos, igualmente, em organizações cada vez mais digitais. Isto traduz-se em inúmeras mais-valias que culminam em processos mais rápidos, eficazes e assertivos (e que facilitam efetivamente o dia-a-dia dos colaboradores), mas a verdade é que também coloca as organizações num grau de

There is a growing group of customers who want to use digital channels. They are also prepared to give businesses more information.


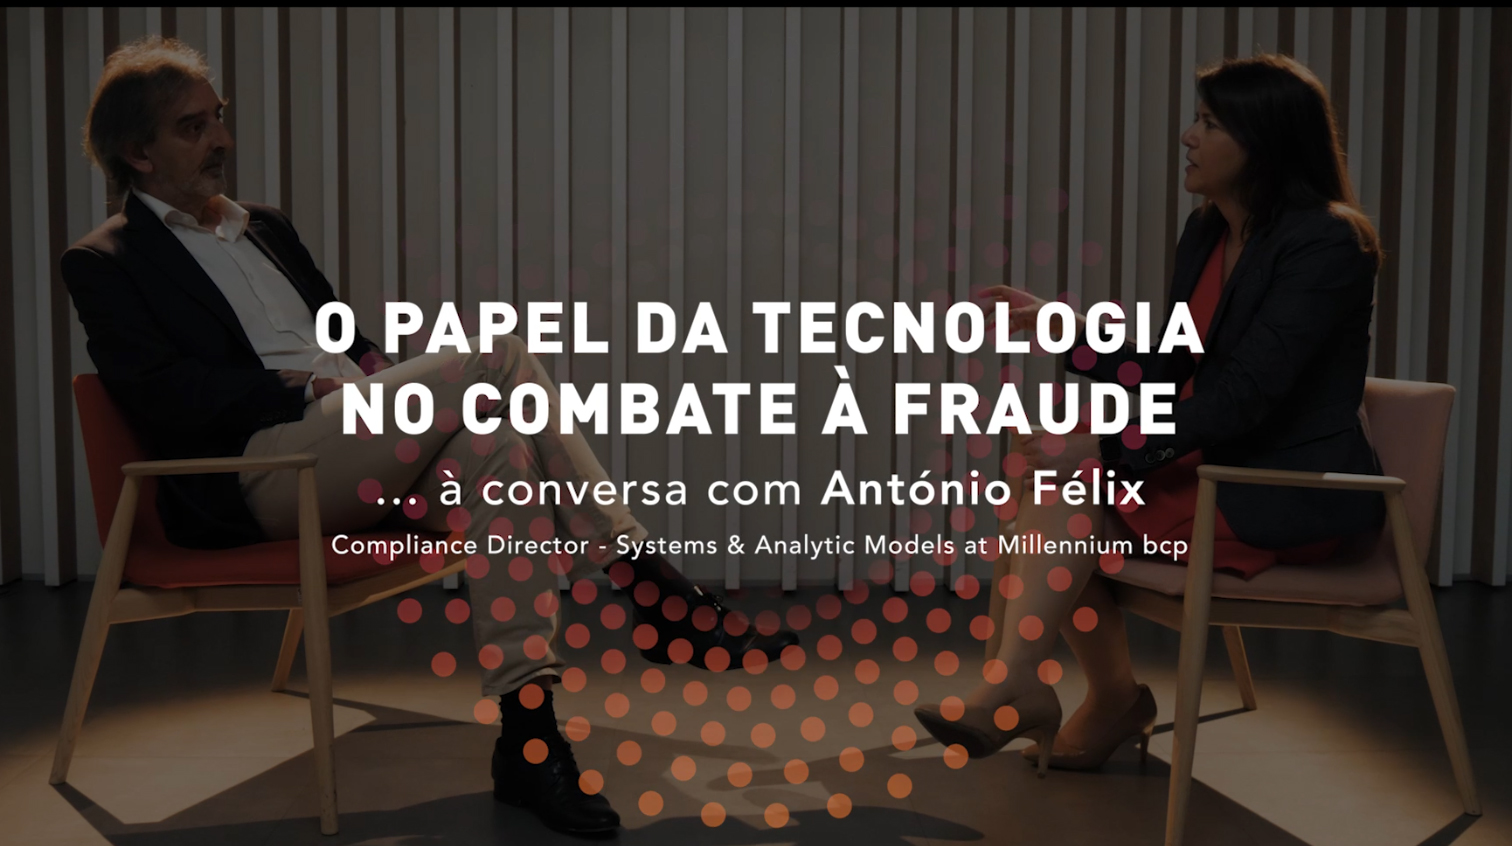
Las aseguradoras afrontan desde hace tiempo una continua batalla contra diferentes tipos de fraude. Fraude en los siniestros, fraude en la suscripción de póliza, ciberataques, fraude interno, etc. En Estados Unidos, un estudio de la Coalition Against Insurance Fraud lo estima en un total de 80.000 millones de dólares. El


Who's to say that 'north' should always be at the top of a map? Perhaps in certain situations, you might want 'south' (or some other direction) to be at the top. Perhaps you're one of our crazy Australian customers who looks at the world a little differently. Well, whatever the

If you’ve ever traveled, you know the excitement of getting to explore a whole new place. After a year of quarantine, people are desperate for that feeling again. As Covid-19 restrictions lift, travel companies need to be prepared for the substantial amount of customer data that will become available. With


If you can’t go more than a few days (or maybe even a few hours) without hearing the words “There’s nothing to eat” or “What else is there to eat?” chances are you live with a teenager. Between their increased energy needs during growth spurts and variations in day-to-day schedules,
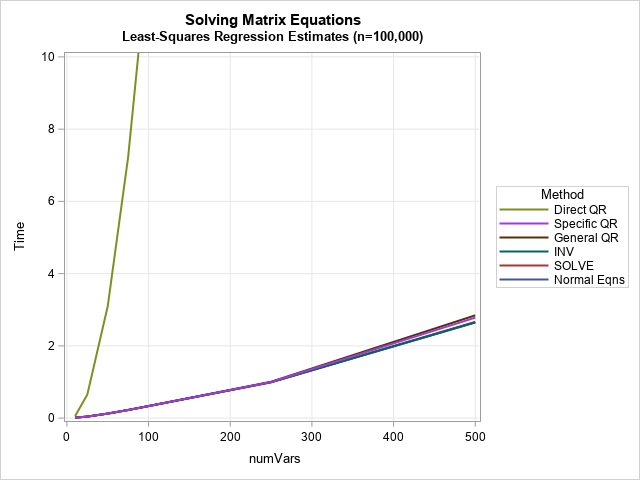

In a previous article, I discussed various ways to solve a least-square linear regression model. I discussed the SWEEP operator (used by many SAS regression routines), the LU-based methods (SOLVE and INV in SAS/IML), and the QR decomposition (CALL QR in SAS/IML). Each method computes the estimates for the regression


Es evidente que las empresas de las telecomunicaciones operan hoy en un entorno complicado que las obliga a tomar decisiones estratégicas importantes que van a definir su negocio en el futuro. Específicamente, son cuatro los factores que influyen en dicho contexto y que tienen un peso significativo en el momento

Understanding the problem Working with character data of different encodings across different systems can occasionally result in failures to translate or transcode that data from its source format to a destination format. When using a SAS/ACCESS LIBNAME engine to query DBMS data, this scenario can end up causing errors when
In computational statistics, there are often several ways to solve the same problem. For example, there are many ways to solve for the least-squares solution of a linear regression model. A SAS programmer recently mentioned that some open-source software uses the QR algorithm to solve least-squares regression problems and asked