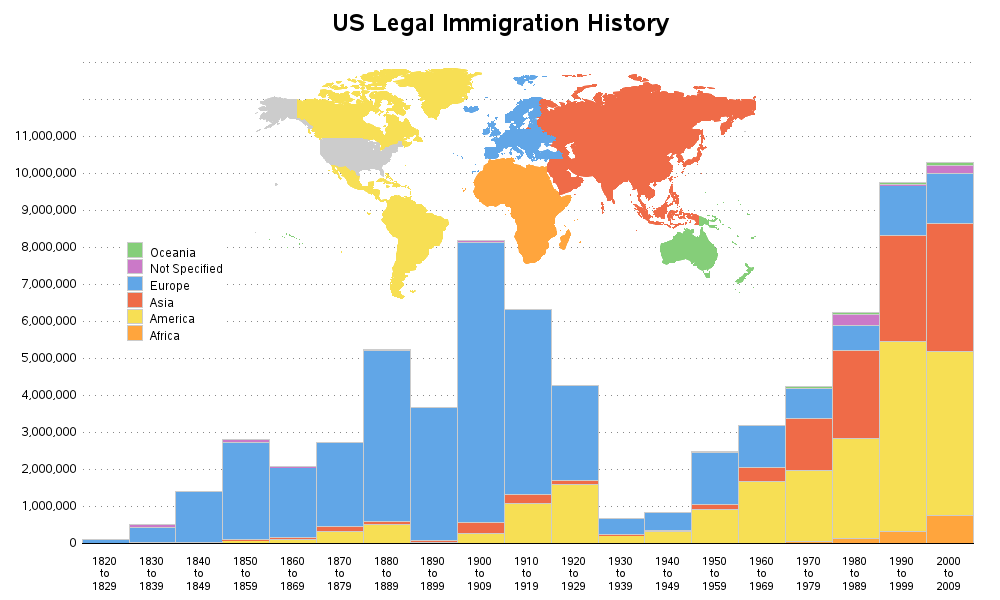
When you spend long enough writing and working in any industry, you inevitably see trends emerge and reach varying levels of maturity. Data governance is one such trend, as you can see from the following Google Trends chart:
Do you like a good horror story? Then may I suggest “Future Crimes” by Marc Goodman. When it comes to this genre, Wes Craven, John Carpenter and Stephen King have got nothing on Goodman, primarily because Goodman’s story is non-fiction. Scene 1: The present – Your workstation or data center Whether
For many of us at some point in our adult lives we will be cooking for just ourselves. For some of us, this means take-out, fast food, or cereal for dinner. But don’t let the convenience of take out and fast food derail your health! Eating real, whole foods, is
Viele Themen, die heute durch den Big Data Trend besetzt werden, sind nicht neu, sondern wurden und werden unter dem Oberbegriff Business Intelligence (BI) verwendet. Auch bei BI spielen große, heterogene und unstrukturierte Datenmengen eine wichtige Rolle.
You can use histograms to visualize the distribution of data. A comparative histogram enables you to compare two or more distributions, which usually represent subpopulations in the data. Common subpopulations include males versus females or a control group versus an experimental group. There are two common ways to construct a
Cada vez más, el consumidor tiene acceso a múltiples canales de comunicación por los cuales puede expresar sus deseos y obtener información sobre servicios y productos. Este tipo de interacción trajo una mayor complejidad a los negocios de las empresas, que necesitan tener mejor control y gestión de relacionamiento con
Our colleagues at the SAS office in Korea recently had the opportunity to interview two customers from KT, one of the biggest telecommunications companies in Korea, about getting SAS certified. Sung-chul Hwang and Gyu-seob Lee both have four SAS certifications – Base Programmer, Advanced Programmer, Statistical Business Analyst and Predictive
In this post, I continue the journey of getting data profiling results into SAS Visual Analytics. In my first blog I described the process of collecting DataFlux Data Quality profiling metrics to load a datamart. Now we load this datamart into memory (LASR) and then plug a VA report on
We recently had a flooding event at Jordan Lake where the water rose almost 20 feet above normal. This blog details that flooding event in both photos and graphs. If you're intrigued by weather, boats, or lakes then this blog's for you! In NC's Research Triangle Park area, there are basically two
.@philsimon lists the gravest data-quality errors.
Händler und Handel haben heutzutage Zugang zu einer enormen Menge an Daten – und damit die Grundlage für eine personalisierte Ansprache, die Kunden inzwischen erwarten. Richtig eingesetzt, kann Analytics der Schlüssel für alle möglichen Geschäftsvorteile sein – sei es, dass es darum geht, ein besseres Online-Erlebnis für den Kunden zu
Most SAS regression procedures support the "stars and bars" operators, which enable you to create models that include main effects and all higher-order interaction effects. You can also easily create models that include all n-way interactions up to a specified value of n. However, it can be a challenge to
Let us continue with our journey beyond standard plots and charts. Often we need to create some simple diagrams to visualize the connections between different entities such as patients and providers or even a social network. Many of you may not have a custom tool to create diagrams. But you have Base SAS, so
In my previous post, Introducing data-driven loops, I suggested a way of implementing programming loops with a list of index variables pulled from an external data table. These ordinary programming loops iterate during code execution while processing some data elements of an input data table. SAS macro loops, on the
In previous articles, I've shared tips about how you can work with SAS and ZIP files without requiring an external tool like WinZip, gzip, or 7-Zip. I've covered: How to create ZIP files with ODS PACKAGE ZIP (available since SAS 9.2) How to "unzip" and read ZIP files using FILENAME
On a recent CBS Sunday Morning episode Dr. Phil McGraw of “Dr. Phil” fame was featured. During the segment he talked about shifting his focus from golf to tennis. To paraphrase, he said golf drove him crazy because he couldn’t bear down, run faster, sweat harder and be better. I
In my previous blog post I talked about how the rapid and varied growth of data calls for states to consider an enterprise analytics program, in the form of a Center of Analytics. This entry, first posted as an article on Government Executive's Route Fifty, gives the most important success
This is my second article about voice of customer analysis; you can find the first here. The first time we discussed that a simple sentiment polarity score was a rather a narrow view. This time we will examine a more insightful approach, using voice of customer analysis to monitor customers’ opinions
In der Vergangenheit hat sich die Agilität von BI-, Big Data- und Analytics- Anwendungen (Datenarchitekturen) als Erfolgsfaktor für Unternehmen aus unterschiedlichsten Branchen erwiesen. Gerade die Integration neuer Datenquellen in bestehende DWH-Architekturen und die daraus resultierenden Anpassungen resultieren in langwierigen Entwicklungsprozessen.
Here's a golf puzzle from Sam Loyd: Everybody is playing golf now, and even the lazy ones who a few weeks ago declared how much pleasanter it was to swing in a shady hammock, have caught the golf fever and are chasing the ball around the golf links. I am
I took my first Uber ride recently. I was with a colleague and we were going into the office before dawn to finish a presentation we were making later that morning. As our Uber driver accelerated to merge onto the interstate, we heard a high-pitched whine and smelled hot metal
I've been doing some investigation into Apache Spark, and I'm particularly intrigued by the concept of the resilient distributed dataset, or RDD. According to the Apache Spark website, an RDD is “a fault-tolerant collection of elements that can be operated on in parallel.” Two aspects of the RDD are particularly
There’s been quite a lot of chatter lately about my Boston Red Sox and their recent shift ‘away’ from using analytics or ‘sabermetrics,’ as data science is often referred to in baseball (Jeff Passan, one of my favorite baseball writers, chimes in here – Forbes also commented that the Sox are
El año pasado no fue fácil para la economía del país, por lo que este año se prevén riesgos de los cuales toda empresa debe estar consciente. La caída en los ingresos petroleros, la estabilización en los ingresos tributarios, el alza de tasas por parte de Fed y un crecimiento
Have you ever found a graph of some interesting information, but the graph was difficult to understand (or even misleading). I strive to fix those graphs - this time it's a graph of US immigration data... I found the following immigration graph on the flowingdata website - it's a screen-capture of
¿Cómo las empresas pueden gestionar adecuadamente su gran volumen de información? ¿Están los datos de su organización listos para convertirse en la clave para alcanzar sus objetivos empresariales? ¿Cómo tomar las mejores decisiones a partir de la analítica? No cabe duda, en un mundo cada vez más conectado el Big
As the torrential downpour of rain and gusty winds hit The Triangle and much of the south last week, I was keenly aware of behavior…my dog’s behavior. With the wetness of their paws, they would enter the house and immediately sit on a towel so we could dry them. Opportunity to
Last week I showed how to create dummy variables in SAS by using the GLMMOD procedure. The procedure enables you to create design matrices that encode continuous variables, categorical variables, and their interactions. You can use dummy variables to replace categorical variables in procedures that do not support a CLASS
I recently received a call from a colleague that is using parallel processing in a grid environment; he lamented that SAS Enterprise Guide did not show in the work library any of the tables that were successfully created in his project. The issue was very clear in my mind, but
Según el psicólogo americano Frederic Skinner, las consecuencias de una acción influyen directamente en la probabilidad de que esta acción se repita. Llevando esta afirmación para el mundo de los negocios, podemos concluir que, cuando tenemos una experiencia negativa en un site de e-commerce, es poco probable que regresemos a