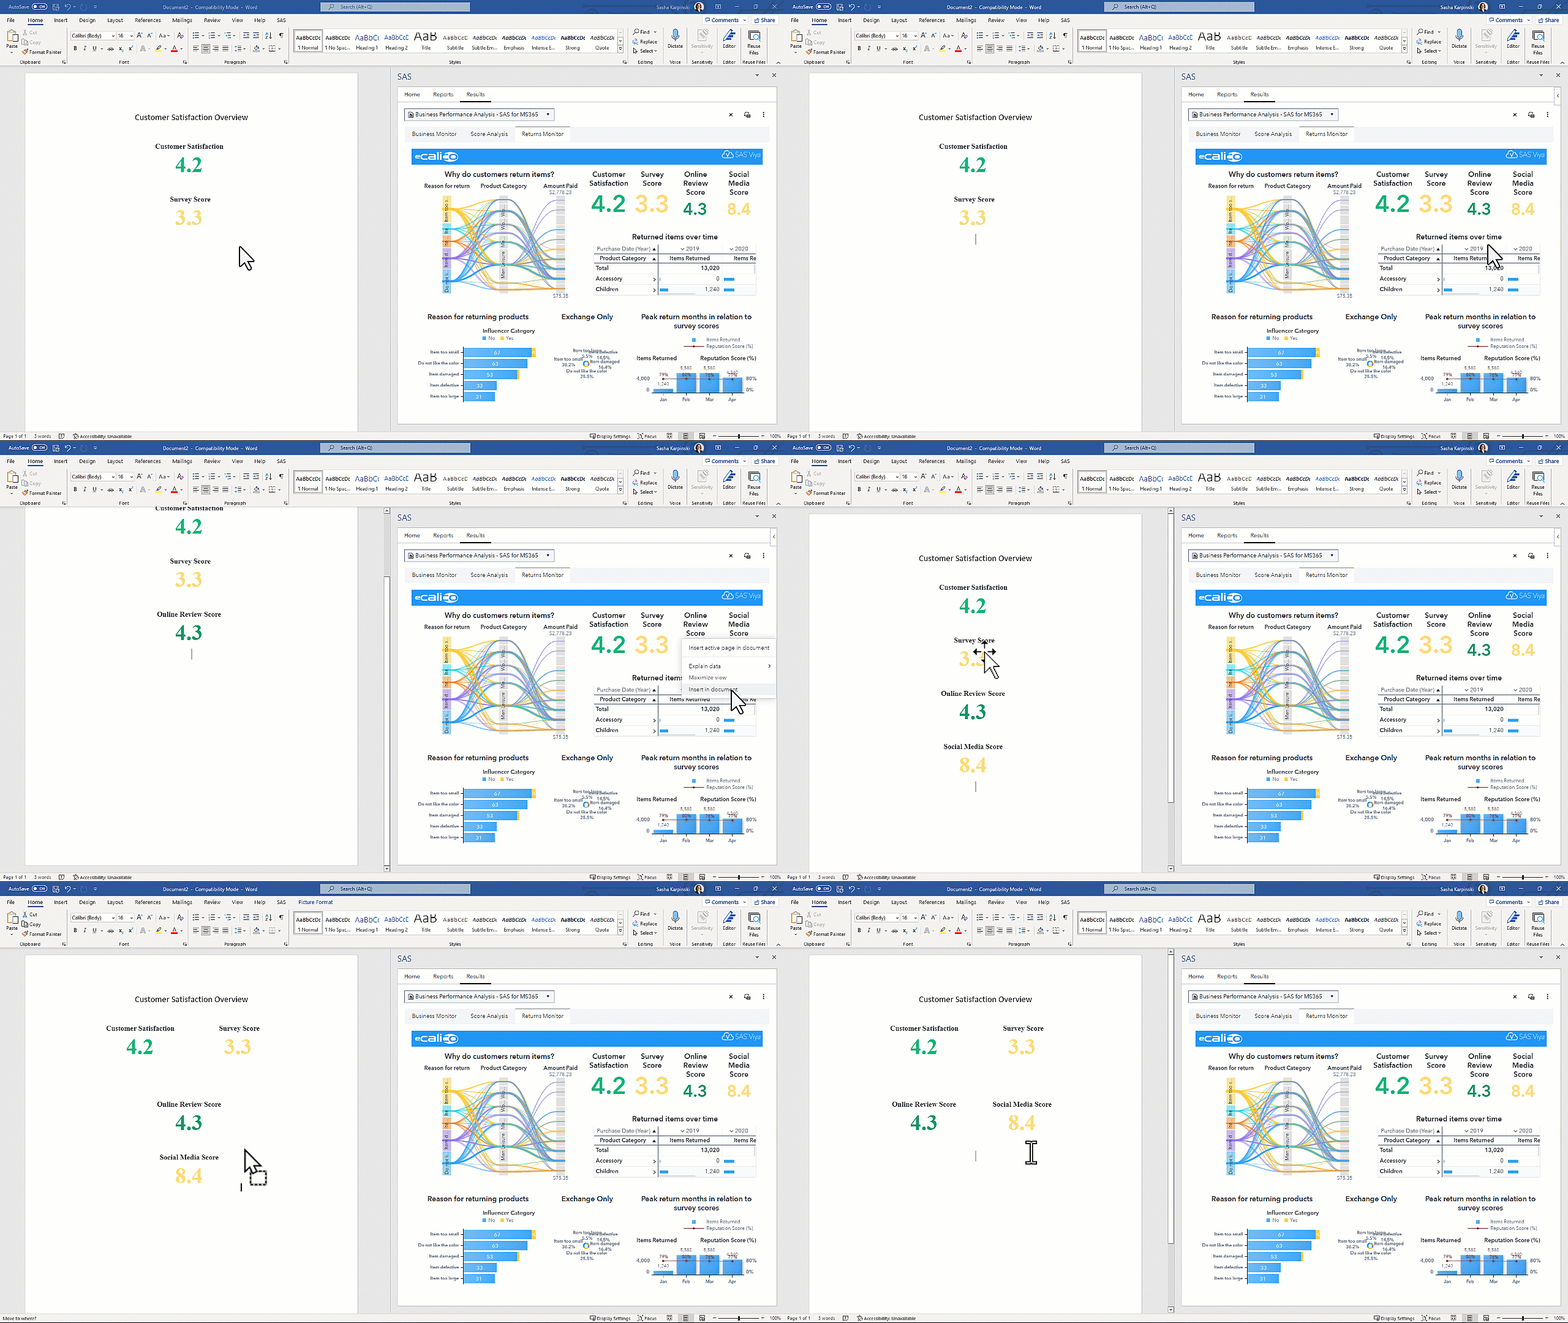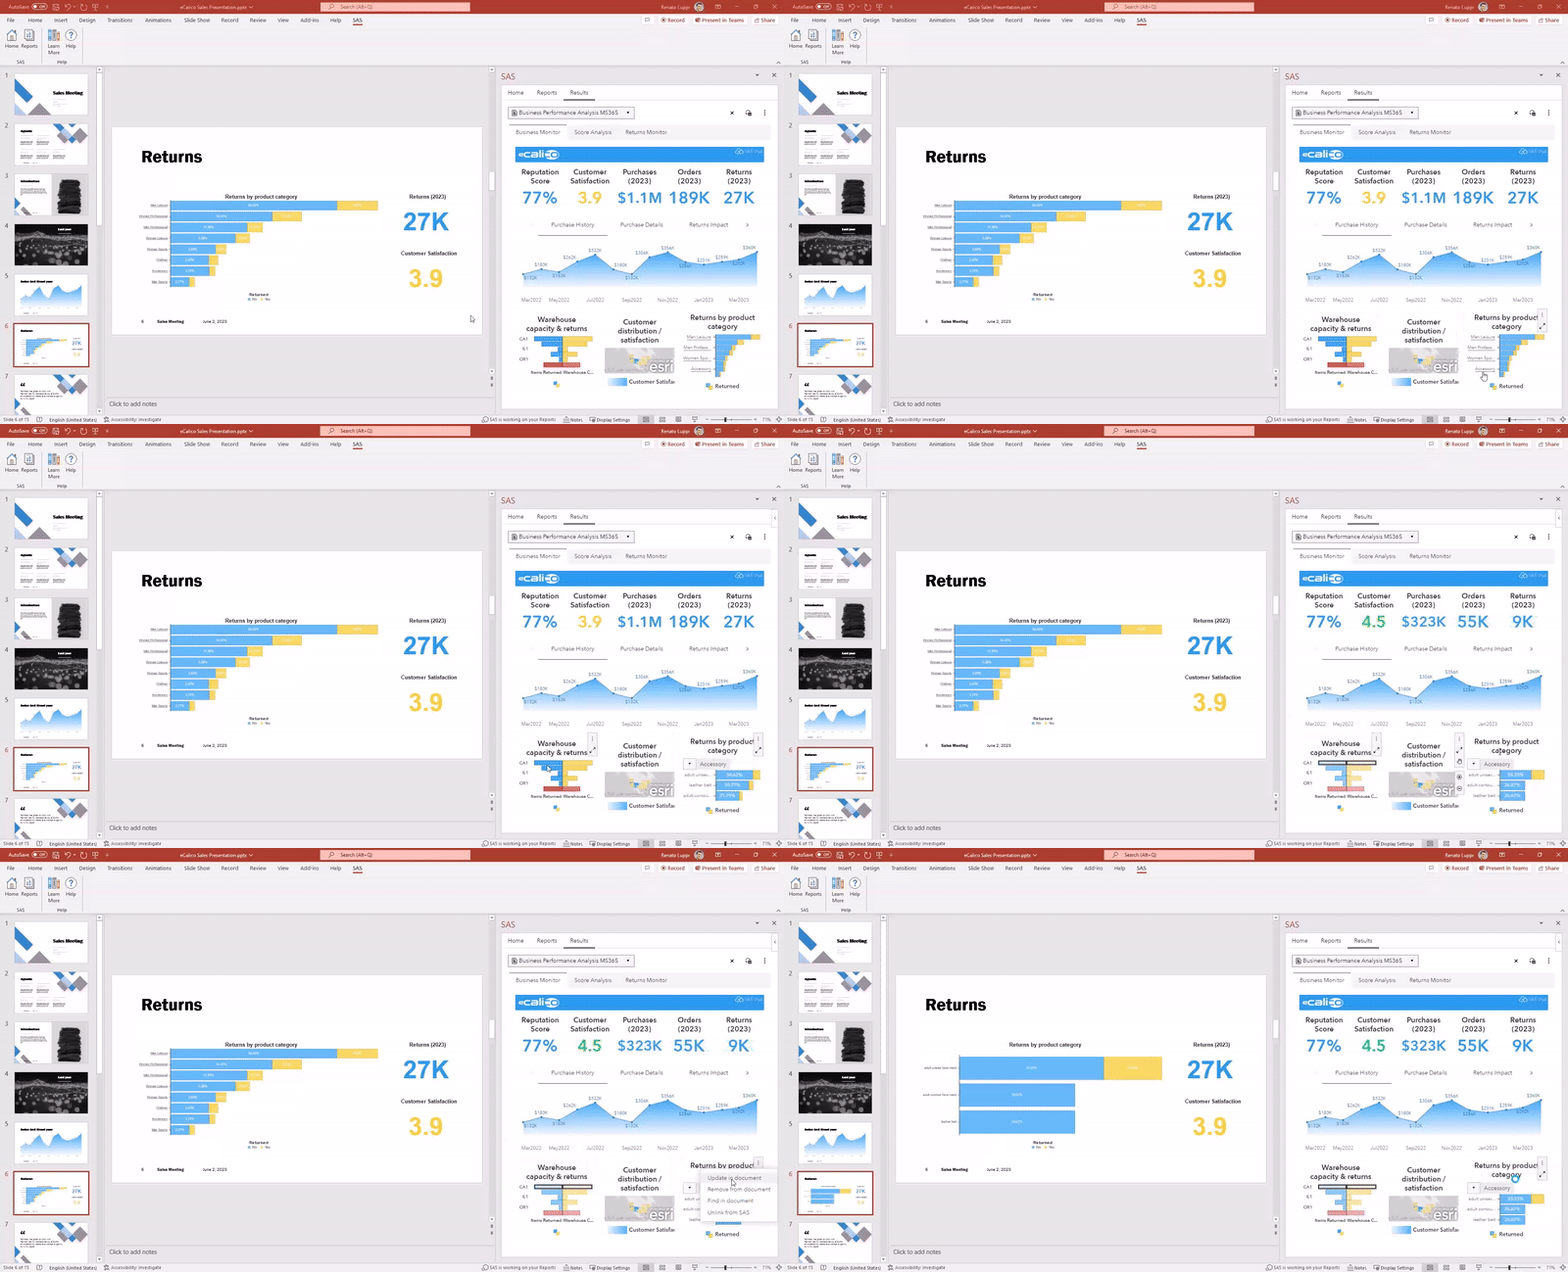
No importa el tamaño de su organización, usted necesita una solución que le permita explorar todos los datos relevantes que se generan a diario de forma rápida y sencilla, descubriendo oportunidades ocultas e identificando relaciones clave. Todo con el objetivo de tomar las mejores decisiones de manera inmediata y precisa.
Tag: data visualization
When was the last time an informational graph or chart caught your eye? I mean, really caught your eye in a way that made you want to emblazon it on a greeting card or frame it for your office? What’s that…never? Me neither, until I had the opportunity to see
For thousands of years, the human experience has been recorded by storytellers. Stories tell the tale of our lives: beginning, middle and end. Stories document the triumphs and tragedies of heroes and villains and everything in between. Human beings are storytellers -- it's a trait as uniquely human as an
In 2012, the value of big data equity in the UK was estimated at £12 billion a year or 0.7 percent of the annual Gross Domestic Product (GDP). Four years flew by and the second report by the Centre for Economics and Business Research (Cebr) puts the opportunity at £46
If a picture is worth a thousand words, then visualizing data in Hadoop would be like a billion. Over the last few years, organizations have rushed to leverage the low-cost distributed computing and storage power of Hadoop clusters. As Hadoop environments mature and move away from their initial focus of
Universities using data is a topic close to SAS’ heart, and in a recent blog we talked about the specific challenges that UK universities face in attracting and keeping students, and how data can help universities better understand the student lifecycle. The first Universities and College Admissions Services (UCAS) deadline
.@philsimon on the convergence between tools such as Hadoop and strategy.
How do public higher education institutions get funded? In the past, state funding was tied to enrollment, but now more states are tying funding to institutional performance. State Legislatures want more accountability for money spent on higher education and have turned to performance-based funding (also called outcomes-based funding). As such,
Hidely-hodely, everyone! As you might imagine, the size and variety of the gift inventory at the North Pole puts Wal-Mart to shame. And while we’ve been at this for hundreds of years, we still make too many of some things and not enough of others. No elf can forget the
Times have changed. As the oil industry shutters and sheds investments that made sense during the two-year period in which oil rode comfortably above $90, the market is establishing a new equilibrium at $40/barrel. This despite the fact that the Baker Hughes domestic rig count is down 64 percent. It’s
Know your data. Do a needs analysis. Organize for success. Empower users. These are four best practices for data and analytics that you'll want to hear more about. In my first three posts in the Analytics in Real Life blog series, we learned how higher education customers are using SAS and why
Do you have a great idea for an analytics project but need approval to get started? Or maybe you've had some initial successes with analytics and you're ready to expand the program. We talked to four analytics leaders in the higher education industry to get their advice on how to
In my first post of the analytics in real life blog series, we heard four higher education customers discuss using SAS and why they chose SAS. Today we will hear the following three customers share the positive impact of using SAS and analytics for their users and institution. Karl Konsdorf, Acting
Though crude oil prices edged up last week, the market remains well below VirtualOil’s original $50 strike price, meaning the hypothetical portfolio’s production is shut in in the spot market again. Oversupply continues while China GDP forecasted growth is slowing. Given the market outlook, the VirtualOil board has decided to
Recently, I interviewed four higher education customers to hear firsthand how each is using analytics in real life (IRL). In this blog series, we will learn how educators are using analytics, why they chose SAS, and the impact it has had on their users and their institutions. In addition, they
Black Dog Syndrome may sound like the clinical term for a Led Zeppelin earworm but, as any animal shelter worker will tell you, it actually describes the challenge black dogs face in getting adopted. This phenomenon is in the spotlight today because Oct. 1 is National Black Dog Day! Black
Every year, Fortune magazine compiles a list of the 500 largest US corporations - called the Fortune 500. Their list was a bit difficult to digest in text-form, so I thought I'd try using some maps & graphs on the data ... For a map analysis, I thought it would
New York City is a pioneer in use of technology in many ways. For instance, the work of the Mayor’s Office of Data Analytics has been cited repeatedly as an example of smart city innovation. But the innovation doesn’t stop there. Two projects that used SAS data visualization and data
I read an article recently discussing how runners inevitably slow down with age, particularly after 50. Data from the New York Marathon and Boston Marathon back this up with generally flat average finishing times for ages 20-49 followed by a steady, almost exponential, increase after 50. I haven’t reached the
Since our last VirtualOil update in May, oil prices have continued to take a beating. As the chart of the rolling five-year portfolio shows, much of our strip of options is now out-of-the-money and the average value per barrel of that optionality has sunk below $7. No surprise then that
Why visualization? Several reasons, actually, the most compelling being that sometimes visualization literally solves the problem for you. I remember an exercise in eighth grade English class where we were asked to describe, in words only, an object set in front of us with sufficient clarity such that our classmates,
Oh, how times have changed during my 20-plus years in the insurance industry. Data wasn’t a word we used much back in the 80s and 90s, unless of course you worked in those arcane and mysterious IT data centres. Even amidst the computerisation of the insurance industry in the 80s, many
We are all modelers. Whenever you plan, you are building a model. Whenever you imagine, you are building a model. When you create, write, paint or speak, you first build in your head a model of what you want to accomplish, and then fill in the details with words, movements
As monsoon season begins, many Nepal earthquake victims have shelter over their heads thanks in part to an unlikely intersection of two SAS global development projects. The first project is with the International Organization for Migration (IOM). IOM is the first responder to any crisis that displaces people. IOM provides
A strong quote from John Tukey explains the essence of data visualization: “The greatest value of a picture is when it forces us to notice what we never expected to see.” Tukey was a famous American mathematician who truly understood data – its structure, patterns and what to look for.
After doing some recent research with IDC®, I got to thinking again about the reasons that organizations of all sizes in all industries are so slow at adopting analytics as part of their ‘business as usual’ operations. While I have no hard statistics on who is and who isn’t adopting
If you use a GPS system or a mapping app on your phone, you're familiar with geospatial intelligence. But did you know this same technology can be used to map the spread of diseases, to understand the spread of wildfires, to visualize environmental issues - and much more? The proliferation
The SAS Global Certification program is proud to announce the release of a new credential: SAS Certified Visual Business Analyst Using SAS Visual Analytics. This credential is designed for analysts who are using SAS Visual Analytics to explore data and create insightful data visualizations. With SAS Visual Analytics now deployed in over
Big data. Streaming data. Complex data. We’ve all heard the reasons why organizations feel like they’re facing an insurmountable data challenge. Now, it’s time to do something about it. For the past few years, SAS has helped some of the world’s leading companies make sense of an avalanche of data.