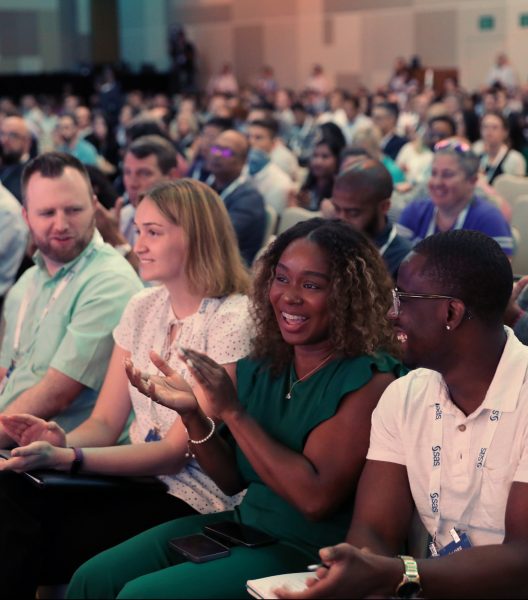
7 sessions you don’t want to miss at SAS Innovate

Do you get excited about the newest innovations and technologies on the market, the world of data and the future of AI? Then mark your calendars because SAS Innovate in Las Vegas is just around the corner. SAS Innovate, our annual event for business leaders, technical users and SAS partners,