 The Third PharmaSUG-China conference was held in Beijing last week, and I had the pleasure to attend this excellent conference along with a record number of attendees.
On Thursday, I presented two 1/2 day seminars on ODS Graphics. One titled "Advanced Topics in GTL" and another titled "Complex Clinical Graphs using SAS". The attendees were eager to learn and the sessions included much discussion, which is always a lot of fun.
The opening session included a presentation of using JMP Clinical for analysis of clinical data. 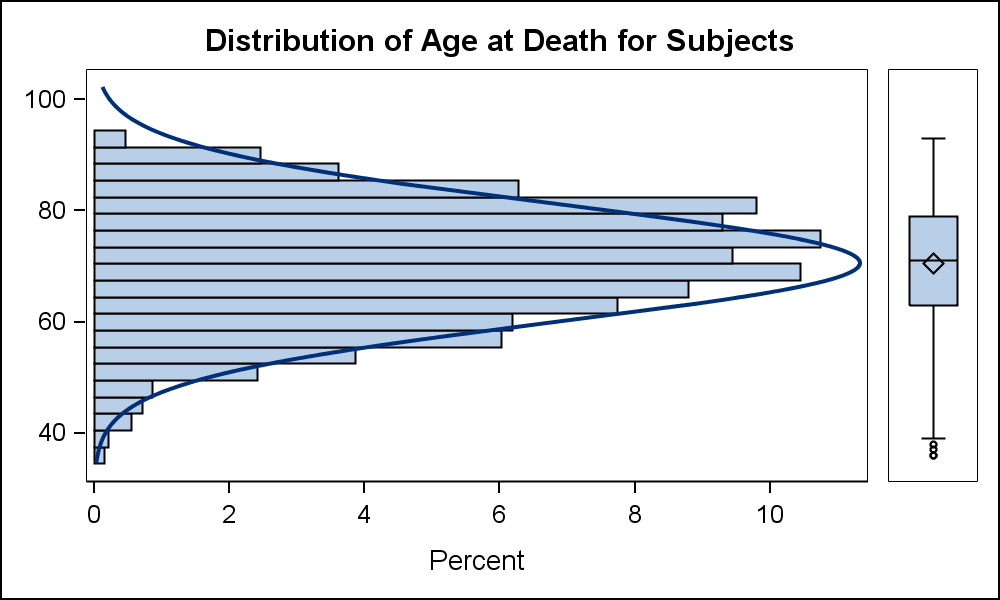 The presentation included a graph of Study Demographics. Later in the afternoon, I thought it would be appropriate to create the same graph in my presentation on ODS Graphics Designer. The graph is shown on the right.
Friday and Saturday were filled with many presentations on interesting topics in the Programming Techniques and Coder's Corner sections, especially from a graphics perspective. Conference proceedings are now available.
 The afternoon also included an excellent presentation on the Essentials of PDV by Arthur Li and Napoleon Plot by Kriss Harris. Unfortunately, the papers are not available on the proceedings page at this time.
Rajesh Moorakonda, Singapore Clinical Research Institute presented a paper on Monitoring Child Growth that included graphs that plot the anthropometric parameters on a growth chart using the GPLOT procedure as shown on the right.
 The Saturday session included the "Coder's Corner" section which included many interesting papers including a fair share of papers on graphics techniques.
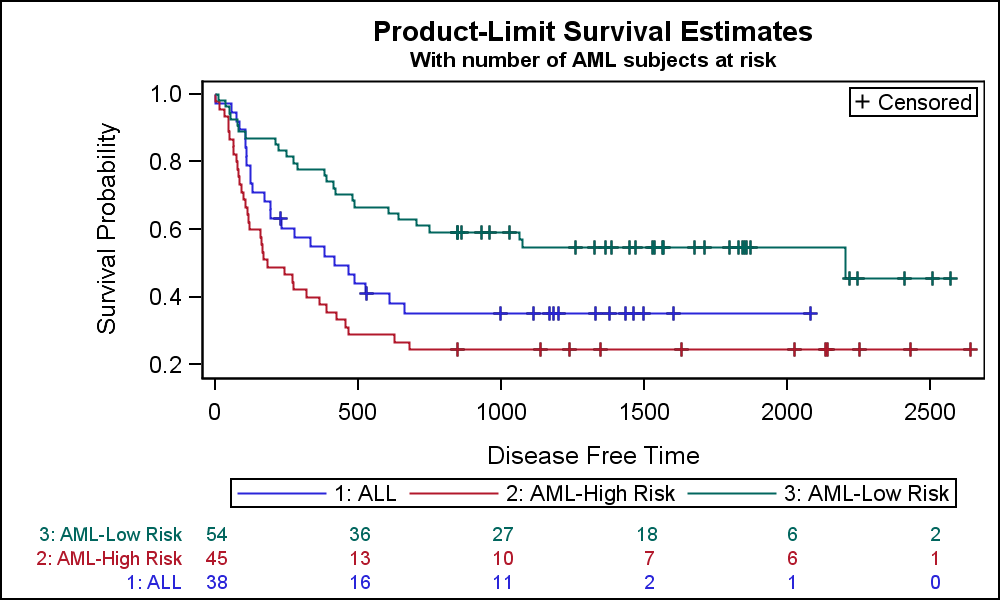
In my presentation titled "Annotate Your SGPLOT Graphs" I presented the basic techniques for annotating an SGPLOT graph using the SGAnnotation data set. I demonstrated how to add a table of subjects at risk by class to a survival plot. The paper contains the details on how to make this graph.
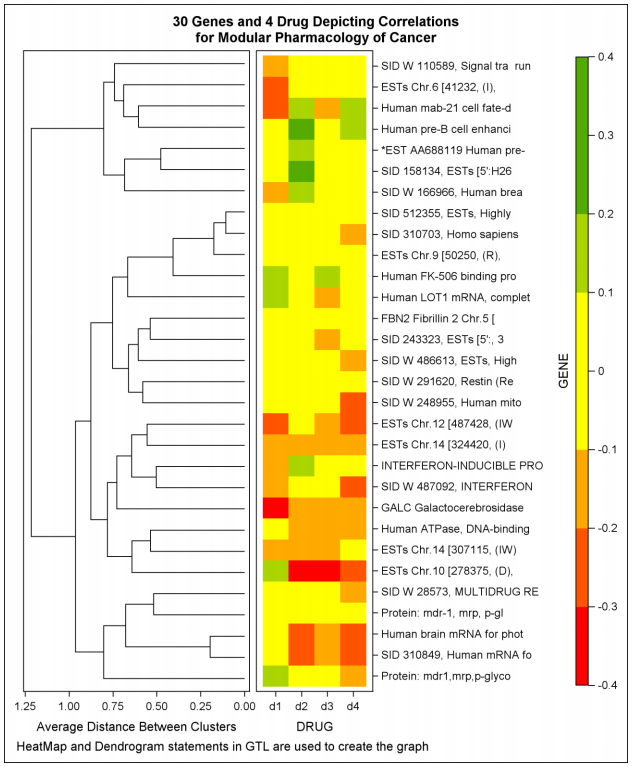 Debpriya Sarker of SAS Institute Pune, presented his paper on "Plotting Against Cancer: Creating Oncology Plots using SAS". This paper included the techniques for creating many graphs used in the analysis of data for Oncology, such as the HeatMap depicting correlations for Genes and Drugs.
Huashan Huo, PPD Beijing presented the paper on "Using SAS SG Procedures to Create and Enhance Figures in Pharmaceutical Industry". This paper included multiple graphs created using ODS Graphics Designer, GTL and SG Procedures, including the graph of Median of Lipid Profile over time, where the authors added alternate vertical bands to clearly indicate the results for specific days of the study.
 Presentations were done on "I am Legend" by Kriss Harris showing ways to create a stand alone legend for cases where the legend can get too big to fit in a graph and "Programming Figures beyond SGPLOT and GTL" where the author showed ways to create graphs beyond what can be directly created using SGPLOT or GTL plot statements. Unfortunately, the papers for these are not available on the web page.
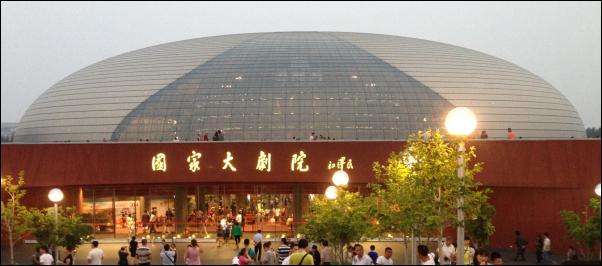
Beijing afforded a great venue for the conference. A bustling city of historical and modern elements, it provides numerous attractions, ranging from the 2000 year old Great Wall to the majestic Forbidden City to the ultra-modern National Center for the Performing Arts.