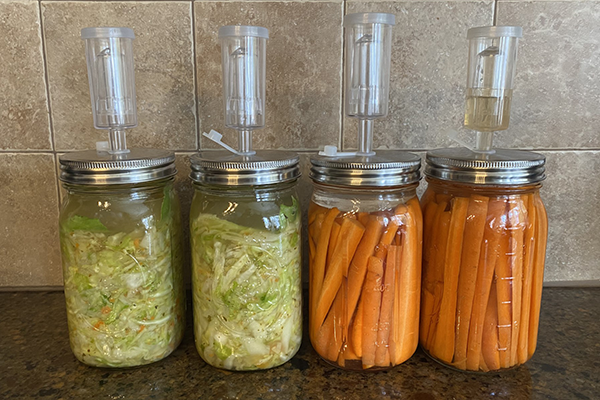
The term Data Scientist is in vogue right now. Let’s explore Data Science, what key skills make a data scientist and how SAS’ Academy of Data Science may help advance your career. The term "data science" (originally used interchangeably with "datalogy") has existed for over thirty years and was used
English
![](https://blogs.sas.com/content/sgf/files/2015/06/SASCares.jpg)
Do you need help finding product information or navigating the SAS website or options for getting started with SAS? Do you need, information about course availability and registrations, training discounts, and certifications? Would access to sample code be helpful? How about, event-related support, assistance identifying and connecting with the right person
![](https://blogs.sas.com/content/sastraining/files/2016/08/us_primary_election_2016.png)
How is it that 91% of the US didn't vote for either Hillary or Trump in the primary, but yet they're still the final two candidates in the presidential election? Let's break it down with a simple graph! I recently saw a really cool slideshow on the nytimes website, that answered
![Analytics Experience 2016 logo](https://blogs.sas.com/content/sascom/files/2016/07/1464037026405-150x53.png)
The digital disruption is creating unforeseen events, such as new competitors, products and services that threaten the performance and positioning of consolidated players. Big data and analytics prove themselves, through successful user cases, as the answer to intercept the demand, prevent churn, draw an integrated view of the customer, manage
![](https://blogs.sas.com/content/subconsciousmusings/files/2016/08/Varun-chart-1.jpg)
Multi-echelon inventory optimization is ever more a requirement in this era of globalization, which is both a boon and bane for manufacturing companies. Optimizing pricing is also important. Global reach allows these companies to expand to new territories but at the same time increases the competition on their home turf.
![](https://blogs.sas.com/content/sgf/files/2016/08/Testing-EMC-Storage-and-Veritas-shared-file-systems.jpg)
In my current role I have the privilege of managing the Performance Lab in SAS R&D. Helping users work through performance challenges is a critical part of the Lab’s mission. This spring, my team has been actively testing new and enhanced storage arrays from EMC along with the Veritas clustered
![Lady grocery shopping](https://blogs.sas.com/content/sascom/files/2016/08/460703903.jpg)
Every grocery store must be laser focused on those things that maintain a competitive edge in this saturated market. In Bedford, NH, with a population around 21,000, there are six grocery stores and two mass merchants who sell groceries. If Bedford is like the national average, these food retailers are
![](https://blogs.sas.com/content/datamanagement/files/2016/08/468839495.jpg)
![](https://blogs.sas.com/content/sastraining/files/2016/08/reggies_religious_antiques.jpg)
I usually try to avoid political or religious debates ... but as an impartial data analyst, it is possible to analyze data about something, without entering into the debate. In this blog post, I try to walk that fine line, and analyze data about the political leanings of religious groups in the US.
![](https://blogs.sas.com/content/sastraining/files/2016/08/IntroImage.jpg)
Any subject matter expert (SME) who has written test questions will tell you it is a lot harder and much more time consuming than they initially expected. Many believe they can simply write down any topic-related question that pops in their mind. Easy, right? Not so fast. Questions should be
![](https://blogs.sas.com/content/sgf/files/2016/08/Color-Names-Formats-Macros-ODS-Excel®-and-PROC-REPORT.jpg)
Not too long ago I had a report generation request from an Alaska state agency. The request had some very specific requirements that detailed the use of user defined colors (by name), data driven control of the report, and Excel delivery using ODS and PROC REPORT. Along the way I had
![](https://blogs.sas.com/content/datamanagement/files/2016/08/42-20358875.jpg)
Data access and data privacy are often fundamentally at odds with each other. Organizations want unfettered access to the data describing customers. Meanwhile, customers want their data – especially their personally identifiable information – to remain as private as possible. Organizations need to protect data privacy by only granting data access to authorized
My presentation at SAS Global Forum 2016 was titled "Writing Packages: A New Way to Distribute and Use SAS/IML Programs." The paper was published in the conference proceedings several months ago, but I recently recorded a short video that gives an overview of using and creating packages in SAS/IML 14.1:
![](https://blogs.sas.com/content/sascom/files/2016/07/EU-002.jpg)
Some weeks have passed since the United Kingdom voted, by a margin of 52 per cent for and 48 per cent against, to leave the European Union, the organization it's been a leading member of since 1973. The tumultuous global reaction to the vote has those of us in information
![LA Highway lit up at dusk](https://blogs.sas.com/content/sascom/files/2016/08/42-25482791.jpg)
Applying analytics to IoT data provides opportunities for cities to use information from sensors, citizens and connected infrastructure in unprecedented ways.
![](https://blogs.sas.com/content/sgf/files/2016/08/Update-your-SAS-license02.jpg)
One of the jobs of SAS Administrators is keeping the SAS license current. In the past, all you needed to do was update the license for Foundation SAS and you were done. This task can be performed by selecting the Renew SAS Software option in the SAS Deployment Manager. More recently,
![](https://blogs.sas.com/content/sastraining/files/2016/08/pinheiro_car-125x150.jpg)
Carlos Pinheiro is talented. One afternoon Carlos stood in front of a group of marketers including myself, and shared social network analysis using our data. Yes, the analysis took talent, but the real brilliance was that Carlos presented the information in a way where we all left the meeting with
![](https://blogs.sas.com/content/brightdata/files/2016/04/analytics-lifecycle.png)
In the digital era data analysis is not even a necessity, but an everyday task of any company. The effectiveness and efficiency of decision-making processes has a key influence on whether the organization is successful or fails. The use of advanced analytics in order to obtain the best possible recommendations
![](https://blogs.sas.com/content/efs/files/2017/01/SAS-Culture-1.png)
Sleep has never been my forté. Even as I child, I dreamt of a world where the sun would never set and I could play ad infinitum. When Dr. Gupta opened her "Importance of Sleep" seminar in May with an observation that many people disdain sleep and equate it with
![](https://blogs.sas.com/content/graphicallyspeaking/files/2016/08/America100CollegeStudents.png)
A few weeks back I posted an article on ways to create a WindRose Graph using SGPLOT procedure. The process is relatively simple. Create (R, Theta) data with both numeric axes where the Theta is a value in the data range is 0-360, and R is the corresponding response value. Then
![man in server room contemplating data lakes](https://blogs.sas.com/content/datamanagement/files/2016/08/139813632.jpg)
A long time ago, I worked for a company that had positioned itself as basically a third-party “data trust” to perform collaborative analytics. The business proposition was to engage different types of organizations whose customer bases overlapped, ingest their data sets, and perform a number of analyses using the accumulated
![](https://blogs.sas.com/content/brightdata/files/2016/07/DIKW-hierarchy.png)
How often does a graph change the world? In 1854, Doctor John Snow produced a map to plotter cholera cases by drawing on a London map a bar for each reported death. Until then, it was believed that cholera was spread by miasma in the air, however, transmission method has
![](https://blogs.sas.com/content/sastraining/files/2016/07/42-46618917.jpg)
What would come to mind if you were told that you have to attend a SAS training course? Perhaps, you have a vision of an instructor sitting at the front of a classroom, endlessly reading PowerPoint slides verbatim in a monotonous voice while you sit there baffled, wondering what is
![](https://blogs.sas.com/content/iml/files/2016/08/kdeHDR2.png)
In a scatter plot, the regions where observations are packed tightly are areas of high density. A contour plot or heat map of a bivariate kernel density estimate (KDE) is one way to visualize regions of high density. A SAS customer asked whether it is possible to use SAS to
![](https://blogs.sas.com/content/sascom/files/2016/07/swimpath.png)
I’m an avid open water swimmer. In order to succeed in open water races I must do two things: I must sight properly in order to swim the straightest line possible in the right direction. The straighter the line, the less I have to swim. I must use a powerful,
![](https://blogs.sas.com/content/sastraining/files/2016/07/pokemon_map1.png)
Were you the kid who sat there analyzing the amusement park map before entering the park, planning out how you could visit the most rides in the least amount of time? If so, then this blog's for you, my data analyst kindred spirit! And to get you in the mood,
![](https://blogs.sas.com/content/iml/files/2016/06/femaleleaders.png)
This week Hillary Clinton became the first woman to be nominated for president of the US by a major political party. Although this is a first for the US, many other countries have already passed this milestone. In fact, 60 countries have already elected women as presidents and prime ministers.
![](https://blogs.sas.com/content/sastraining/files/2016/07/social_networks_20162.png)
The way your graph looks can make all the difference ... two people can graph the exact same data in essentially the same way, but one of the two graphs can be perceived as much better than the other. Hopefully reading my blogs will help you create the better graph!
![](https://blogs.sas.com/content/datamanagement/files/2017/01/DataMgt-2.png)
Why they will still play a valuable role in organizational data-management and -integration efforts.
![](https://blogs.sas.com/content/sgf/files/2016/07/AnalyticsExperienceConference.jpg)
First it was the patriarch of my favorite family. That shocking Red Wedding scene meant I could cross off several more characters I’d grown to love. When the season finale of Season 5 left me asking if we’d lost yet another one of my favorites, I wasn’t sure how much