Multi-echelon inventory optimization is ever more a requirement in this era of globalization, which is both a boon and bane for manufacturing companies. Optimizing pricing is also important. Global reach allows these companies to expand to new territories but at the same time increases the competition on their home turf. Consider General Motors (GM), which faces new competition at home from Asian manufacturers such as Hyundai and Kia but has also benefited by global expansion. In 2015, they sold 63% of their vehicles outside North America. In fact, GM and their joint ventures sold as many vehicles in China as in North America. The supply chain of most manufacturing companies has also expanded globally, because most of them source their raw materials from different parts of the world, making their supply chain more complex, which is why a holistic approach to optimize the entire supply chain is critical. However, customers still expect the same great service despite the complexity, which is why multi-echelon inventory optimization can provide real benefits to global companies, particularly if they also optimize their pricing.
A major durables goods company in this situation partnered with SAS to leverage our advanced analytics capabilities to improve their profitability and right-size their inventory. The company built a new pricing platform that helps them design data-driven pricing and promotion strategies. SAS® Demand-Driven Planning and Optimization provided this company with a structured and efficient process to right-size the inventory in their complex, multi-echelon supply chain network. This new adaptive platform uses SAS/OR, SAS Visual Analytics and SAS Office Analytics to provide a scalable solution for multi-echelon inventory optimization.
The durable goods company sells their products to end consumers through retailers, who in turn represent their customers. The transactions between the company and retail customer are called invoice data, and the transactions between retail customers and end consumers are called retail sales data. The retail sales data is ten times larger than invoice data. The ability to visualize these transaction data and identify patterns and areas of improvement from them is critical to designing a successful pricing strategy.
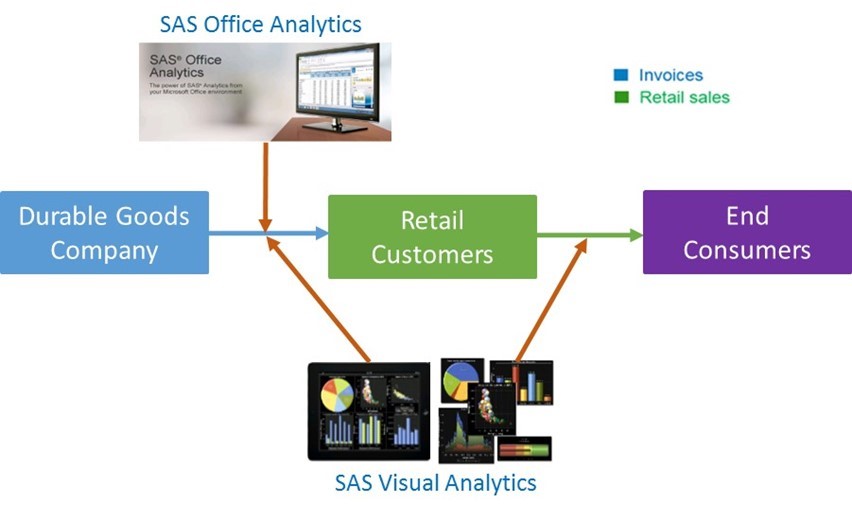 The new platform consists at its heart of a powerful server that can easily be scaled to the growing needs of the durable goods company. SAS/ACCESS engines enable easy connections to a number of different data sources, such as .NET databases or ODBC connections. The results from this computing environment can be surfaced on the web using SAS Visual Analytics or through desktop applications such as Microsoft Excel, Word, or PowerPoint using SAS Office Analytics.
The new pricing process consist of three simple steps:
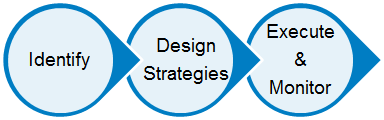
First step: identify areas of improvement
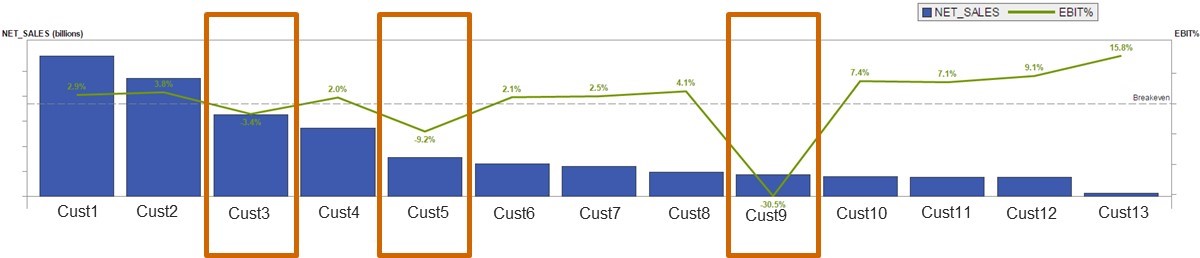
Two primary areas of improvement for this company were related to profitability and market share. Using SAS Visual Analytics it is possible to visualize data using heat maps, waterfall charts, time series plots to quickly identify the customers and products that need improvement. Below is an example of how to easy it is to identify areas of improvement using a SAS Visual Analytics report in the form of a Pareto chart. The X axis shows groupings of customers, the bar chart shows the net sales by customer, and the green line indicates the profitability of these customers for the manufacturer. The customers are shown in descending order by their net revenue. The largest customers are shown on the left side of the Pareto chart and the smallest customers on the right side. Due to economies of scale and the buying power they have, largest customers are expected to provide the lowest profit margin percentage to the manufacturer. So in an ideal scenario, the profitability line should increase monotonically from left to right. In the chart below Cust3, Cust5 and Cust9 are clear outliners whose profitability can be improved.
Second step: design strategies
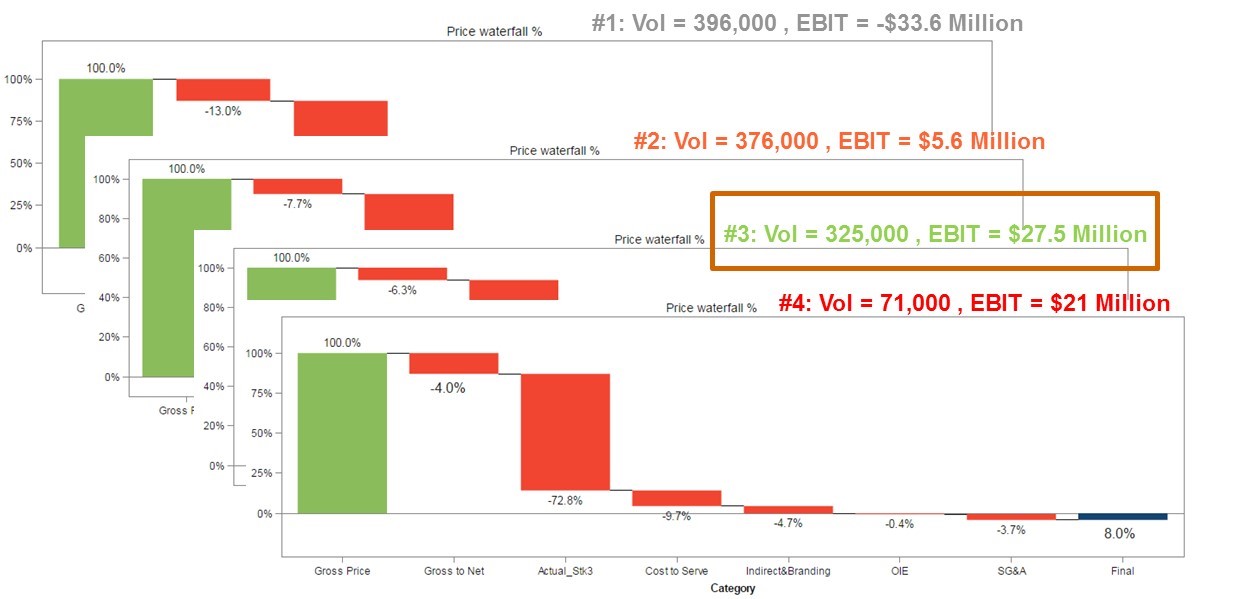
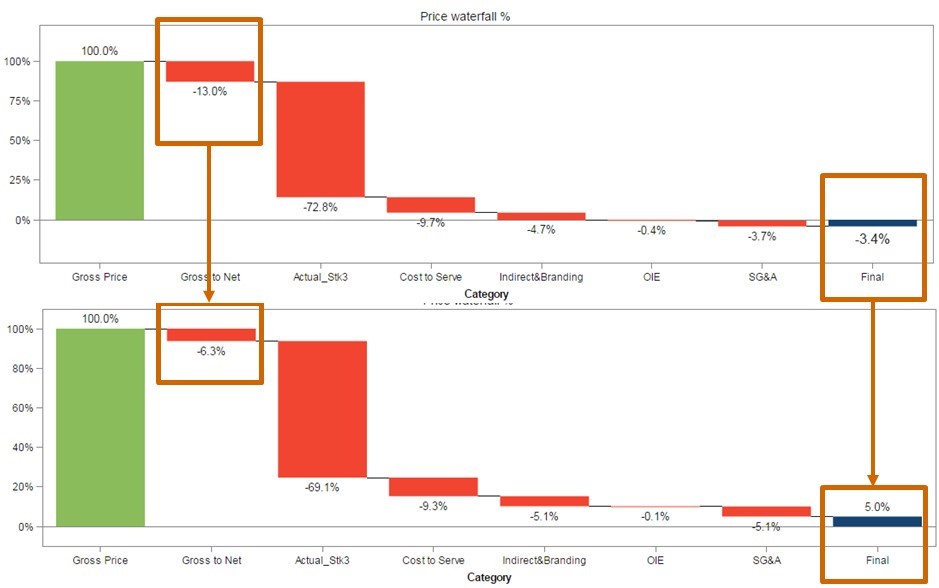
The second step involves designing and simulating different pricing strategies to overcome the challenges identified in step 1. After evaluating the different strategies, we selected the best strategy for implementation. Consider Cust2 from the chart above as we break down and analyze the cost components of Cust2 in detail using a waterfall chart. The first bar indicates the gross price. The second bucket indicates the gross to net (G2N) discounts that are offered to customers to increase the sales. If you are an expert, then you can immediately spot that 13% is very high, because you typically offer G2N discounts between 4% and 10%. So in this case the solution to improve the profitability is to reduce the G2N discounts.

Lowering the G2N discounts will certainly lower sales volume. Win rate curves help identify the volume changes as a result of price changes. Using SAS/OR you can derive a piecewise linear equation to describe the cumulative historical win rate at different price points. You can then use this analytical model to calculate the volume changes due to price changes. For example, let us consider a product with selling price of $300/item and average cost of $200/item. Current annual sales volume is 376,000 (win rate = 95%) and annual earnings before interest & taxes (EBIT) is $5.6 million.
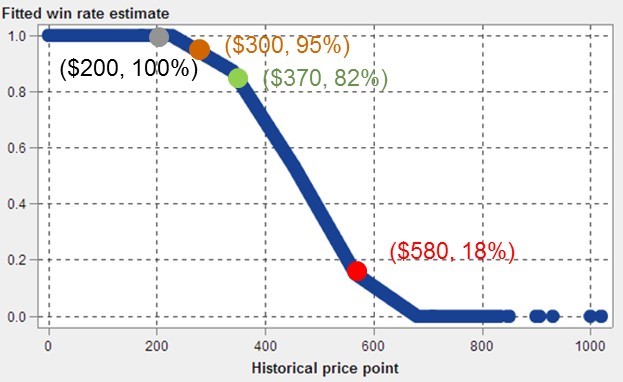
If we were to increase the price to $370, then the win-rate drop to 82%. The new expected annual sales volume is 325,000 and annual EBIT = $27.5 Million. The sales volume could drop significantly if you increase the prices too high. For example if you were to increase the price to $580, then win-rate will drop to only 18% which might be unacceptable as most companies would like to maintain a minimum market-share. SAS/OR can be used to solve this optimization problem to identify the price of the product that maximizes profitability while satisfying constraints such as market share requirements.
 Third step: execute and monitor
In the third step, we implement strategies that we identified in step 2, and importantly we monitor the performance in using Visual Analytics report. The real time monitoring enables you to refine the strategy after it goes live to make sure that we achieve the goals outlined in step 2.
Inventory Optimization
The durable goods company implemented SAS® Inventory Optimization Workbench to right-size the inventory and achieve multi-echelon inventory optimization across their complex supply chain network. The SAS inventory optimization process consists of four steps:
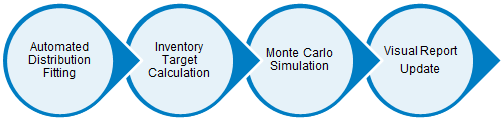
In the first step, we fit identify the probability distribution that best fits the forecasted demand. The SAS Inventory Optimization Workbench (IOW) support a number of continuous distributions, such as normal, log normal and discrete distributions like Poisson and binomial. One of the key differentiators of SAS IOW is its ability to handle intermittent demand. In most supply chain, top 20% of the items account 80% of the total demand. There are lot of items with low demand with high variance. SAS IOW uses a specialized technique called Croston method to handle these intermittent demand items. In the Croston method, demand is estimated through exponential smoothing and the interval between demands is estimated separately. In addition we utilize historical performance to estimate the right amount of safety stock that would satisfy the service level requirements.
The second step is to calculate the inventory target or order-up-to-level. The inventory target consists of three components: pipeline stock, cycle stock, and safety stock. Pipeline stock is the amount of inventory required to cover the demand during lead time while cycle stock is the inventory required to cover the period between replenishment. Safety stock is the amount of inventory required to cover the uncertainty in demand. The variance of forecast data and the desired service level for a given product-location pair are the main drivers for the safety stock calculation.
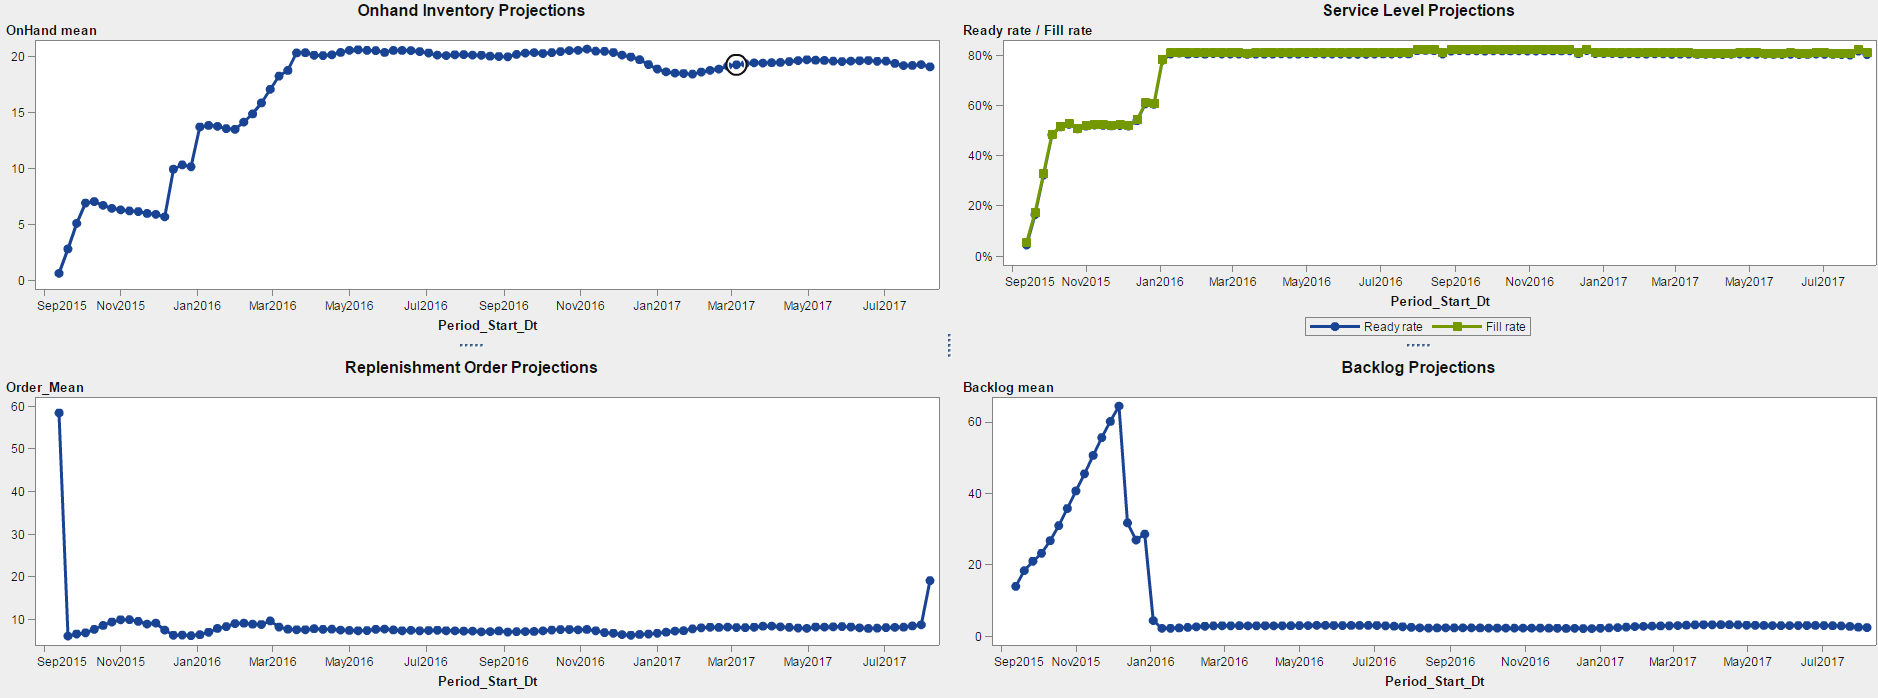
In the third step, we simulate 200 scenarios of forecasted demand over the horizon and calculate KPIs, such as on hand inventory, service level, backlog, and replenishment orders using Monte Carlo Simulation. In the final step, we update the Visual Analytics report using the output from the SAS Inventory Optimization Workbench. Users can easily visualize inventory target, forecasted demand, and project orders over time and use these reports to spot any outliers.
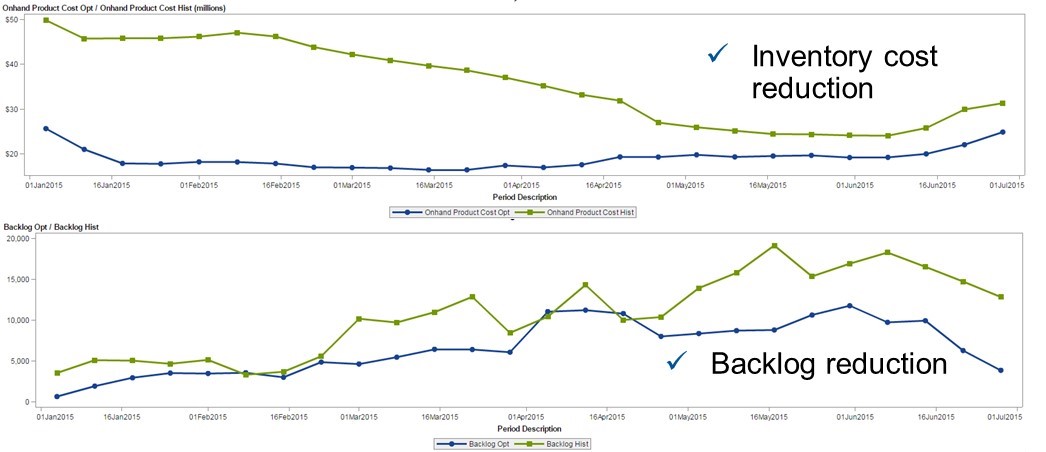
Inventory is a significant investment for every company. So it is critical for supply chain team to estimate the benefits from inventory optimization so that they can set the right expectation with their management team. In addition there are many parameters that needs to be fine-tune periodically to optimize the system performance. SAS team developed a new simulation-optimization approach called Tuning and Validation to overcome these challenges. In the first step, called tuning, we use historical data to automatically calibrate the parameters of the inventory optimization. In second step, we simulate using the optimized policy and compare it to the historical performance to quantify the improvements in KPIs such as inventory cost, backlog, service level etc. as a result of inventory optimization.
 Conclusion
For this durable goods manufacturer, we saw the service level improve from 65% to 92% and backorders reduce from 8% to 2% in 10 months after implementation by using multi-echelon inventory optimization. In addition, with the implementation of the new analytical pricing platform, their analysts can design their pricing and promotion strategies with the click of a button. They can monitor their performance in real-time with visualization. With SAS Demand-Driven Planning and Optimization they have an enhanced, integrated platform for demand planning and multi-echelon inventory optimization, eliminating reliance on multiple Excel-based processes. To learn more about this project you may wish to read this SAS Global Forum 2016 paper, "Leveraging Advanced Analytics in Pricing and Inventory Decisions at a Major Durable Goods Company."