Python ML pipelines with Scikit-learn: A beginner’s guide

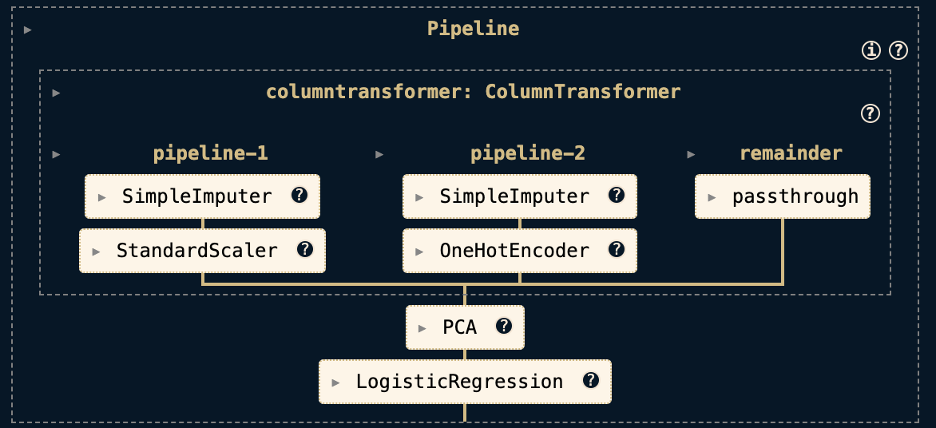
Using SAS Viya Workbench for efficient setup and execution, this beginner-friendly guide shows how Scikit-learn pipelines can streamline machine learning workflows and prevent common errors.