A couple of years ago I shared a method for copying any file within a SAS program. It was a simple approach, copying the file byte-by-byte from one fileref (SAS file reference) to another. My colleague Bruno Müller, a SAS trainer in Switzerland, has since provided a much more robust
Uncategorized
Vor der Wahl hat der Bundeswahlleiter eine interessante Aufgabe, er muss die Wahlkreise so einrichten, dass die Zahl der Wahlkreise in den einzelnen Ländern deren Bevölkerungsanteil soweit wie möglich entspricht. Die Bevölkerungszahl eines Wahlkreises soll nicht mehr als 15 % nach oben oder unten von der durchschnittlichen Bevölkerungszahl der Wahlkreise
There's an old expression "easy as pie." Have you ever tried to bake a pie??? ... It's not so easy, LOL! And neither is using pie charts correctly! :) Below are several examples of different kinds of pie charts you can create with SAS/GRAPH. And at the bottom of this
SAS 9 has supported calling R from the SAS/IML language since 2009. The interface to R is part of the SAS/IML language. However, there have been so many versions of SAS and R since 2009, that it is hard to remember which SAS release supports which versions of R. The
I've written, talked and thought about data management for an entire decade now. In that time, I've collected examples of how data – and the processes for managing that data – can affect our everyday life. For years I used the "Have you ever gotten multiple pieces of mail from
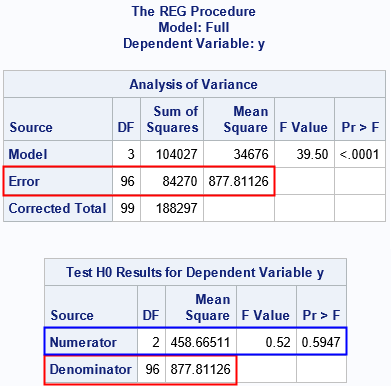
This week I read an interesting blog post that led to a discussion about specifying the frequencies of observations in a regression model. In SAS software, many of the analysis procedures contain a FREQ statement for specifying frequencies and a WEIGHT statement for specifying weights in a weighted regression. Theis
SAS/Foresight Webinar Series The next installment of the quarterly SAS/Foresight webinar series is next Thursday, September 19, at 1:00pm EDT. Demand and Supply Integration: Achieving S&OP's Strategic Promise Join Dr. Mark Moon, Department of Marketing and Supply Chain Management at the University of Tennessee, to discover the benefits of integrating demand
Like many of you teachers out there, I spent a lot of time recently preparing for the new school year. At home, it began with the therapeutic organization of children's rooms. As I sat amid in outgrown clothes, last year’s school work, and books to donate, I braced myself and
SAS Data Management is a popular topic here on the SAS interwebs. You can find all types of information ranging from thought leadership to white papers to product details. At SAS Global Forum I sat down with Nancy Rausch, one of the principal R&D managers behind the SAS Data Management
Do you know how to create a bar chart using SAS, and when to use what kind of bar chart?!? If the answer doesn't come to you "easy as pie" then this blog is for you! Below are several examples of different kinds of bar charts you can create with SAS/GRAPH.
In a previous post, I showed how to solve differential equations in SAS by using the ODE subroutine in the SAS/IML language, which solves initial value problems. This article describes how to draw phase portraits for two classic differential equations: the equations of motion for the simple harmonic oscillator and
Differential equations arise in the modeling of many physical processes, including mechanical and chemical systems. You can solve systems of first-order ordinary differential equations (ODEs) by using the ODE subroutine in the SAS/IML language, which solves initial value problems. This article uses the equations of motion for the classic simple
Mit SAS 9.4 wird der Zugang zu High-Performanche-Analytics-Prozeduren durch zwei wesentliche Neuerungen erleichtert: Zum einen erhalten Nutzer von analytischen Pakten die korrespondierenden HPA-Prozeduren zur Nutzung auf vorhandener SMP-Hardware mit SAS 9.4. Ziel ist es die neuen, beschleunigten Funktionalitäten auf kleineren Datenmengen zunächst zu testen, bevor man auf leistungsfähigere Infrastrukturn umsteigt. Zum anderen
It's been almost 5 years since I posted one of the first custom tasks for SAS Enterprise Guide. It was a task that made it easier to convert SPSS data files into SAS data sets. Like many projects that begin as custom tasks, this one later became a feature in
Last week I presented two talks at the University of Wisconsin at Milwaukee, which has established a new Graduate Certificate in Applied Data Analysis Using SAS. While in Milwaukee, I ran into an old friend: the ODS LISTING destination. One of my presentations was a hands-on workshop titled Getting Started
Die Rahmenbedingungen in Wirtschaft und Gesellschaft haben sich irreversibel geändert: Ein Umbruch jagt den anderen, eine Veränderung überholt die nächste, Unsicherheit nimmt zu. Jeder Versuch, diese Dynamiken durch Detailplanung und verstärkte Kontrolle voll umfänglich in den Griff zu bekommen wird notgedrungen scheitern. Eine Welt des permanenten Wandels verlangt den Abschied
Message from Mohsen Hamoudia (IIF President): For the eleventh year, the International Institute of Forecasters, in collaboration with SAS®, is proud to announce financial support for research on how to improve forecasting methods and business forecasting practice. The award for this year will be two (2) $5,000 grants. The
I am passionate about teaching. My colleagues would probably say this is the understatement of the year. And it likely has something to do with the fact that both of my parents were teachers. I started my teaching career at the university level and after many years an unexpected opportunity
Sometimes it is useful in the SAS/IML language to convert a character string into a vector of one-character values. For example, you might want to count the frequency distribution of characters, which is easy when each character is an element of a vector. The question of how to convert a
Sie kennen SAS als führenden Anbieter von Analytics - aber wussten Sie auch, dass wir Lösungen für das Verteilen von Stammdaten anbieten? Und hier sprechen wir nicht nur davon, dass wir analytische Lösungen mit guten, qualitätsgesicherten Daten füttern, sondern es geht auch um operative Datentöpfe - in Einkauf, Logistik, Produktion.
This week's SAS tip is from Kevin D. Smith and his new book PROC TEMPLATE Made Easy: A Guide for SAS Users. Kevin is a software developer at SAS with extensive experience supporting PROC TEMPLATE and underlying ODS technologies. We're excited that Kevin decided to write his book and hope
Mit Blick auf 2014: Das Motto der CeBIT lautet Datability, also „die Fähigkeit große Datenmengen nachhaltig und verantwortungsvoll zu nutzen“.* Das Leitthema ist gut gewählt - wie bereits Shareconomy in diesem Jahr. Denn aus meiner Sicht startet Datability endlich eine gesellschaftliche Diskussion über unternehmerische Wertschöpfung mittels Datenauswertung – auf Basis
Do you know (right off the top of your head) the simple SAS/GRAPH code you would use to create line graphs? ... If not, then this tutorial is for you! A line plot is basically a scatter plot where the markers are connected. A line plot should only be used
Finding the maximum value of a function is an important task in statistics. There are three approaches to finding a maxima: When the function is available as an analytic expression, you can use an optimization algorithm to find the maxima. For example, in the SAS/IML language, you can use any
Scatter plots are probably the simplest kind of graph, and provide a great way to visually look for relationships between two variables. But, do you know (right off the top of your head) the simple SAS/GRAPH code you would use to create them? ... This tutorial leads you step-by-step through the
Recently I wrote about how to determine the age of your SAS release. Experienced SAS programmers know that you can programatically determine information about your SAS release by using certain automatic macro variables that SAS provides: SYSVER: contains the major and minor version of the SAS release SYSVLONG: contains the
Recently my boss came across a graph where a time series plot was modified to include a "thickness" response. We wondered if this would be a good addition to the GTL / SG Series plot statement. What would the result look like, and what are the pros and cons? So, I took up
Warum gehen Experten heute noch auf Fachmessen und Kundenveranstaltungen? Die meisten Informationen lassen sich doch heute im Internert recherchieren, bequem herunterladen und auf der nächsten Geschäftsreise in Ruhe studieren. Wenn der Bedarf konkreter wird, wird Ihnen jeder Anbieter, wie auch SAS, bereitwillig mit Vor-Ort-Besuchen und Referenztelefonaten zur Verfügung stehen. Was
A common visualization is to compare characteristics of two groups. This article emphasizes two tips that will help make the comparison clear. First, consider graphing the differences between the groups. Second, in any plot that has a categorical axis, sort the categories by a meaningful quantity. This article is motivated
Even the best programmers make mistakes. For most errors, SAS software displays the nature and location of the error, returns control to the programmer, and awaits further instructions. However, there are a handful of insidious errors that cause SAS to think that a statement or program is not finished. For