Some of you may have already noticed the small graphical icon on the lower right side of the blog article labeled "Graphically Speaking Index". Yes, it is a link to a visual index for all articles published in this blog. Well, eventually it will have all the articles.
So far, I have included the twelve most recent articles to get the index started. Click on the icon to go to the visual index.
The page looks like this:
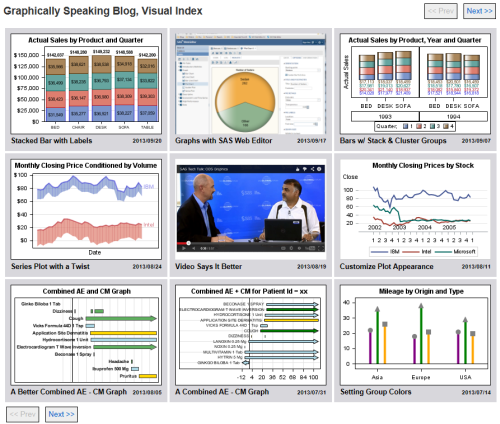
This is the top page of the visual index as it stands today and includes icons for the most recent nine blog articles. Older articles can be seen by choosing the "Next" link. Hmmm, maybe this should be renamed to "Prev"?
I must admit that we added it because I found myself paging back through the articles looking for an earlier article that I wanted to link to. Now, with over 100 articles published, the list is getting long. However, I do believe you too may find this index useful.
As I write new articles, I will keep the index updated. I hope to add icons for previous articles as we go along.


6 Comments
Wow, you even have an entry in your Visual Index for your Visual Index post. That is so meta.
I'm proud to have my profile visually indexed along with your useful graphs.
Yes, it feels a bit like self modifying code.
This is a great idea. It will be much easier than reading the list of titles.
My suggest at SF Forum has now an excellent beginning solution to the growing
number of graphically tips
Pingback: A graphical index to my SAS/GRAPH blogs | The SAS Training Post
I really like the new visual index! Great idea!