In my last blog post I described how to implement a "runs test" in the SAS/IML language. The runs test determines whether a sequence of two values (for example, heads and tails) is likely to have been generated by random chance. This article describes two applications of the runs test. In both cases, you have to recode the data into a two-value sequence in order to use the runs test. The applications are:
- Application 1: Are two samples from the same population?
- Application 2: Given a series of univariate numerical values, is there evidence that the data are random deviations from a constant value?
Are two samples from the same population?
The runs test can be applied to the problem of determining whether two samples are from the same population. If you measure some quantity for two groups, you might want to know whether the distribution of that quantity is the same for both groups.
There are various parametric tests that test whether some parameter is the same in both groups. In SAS software, you can use the TTEST procedure to test whether two samples are from the same normal populations. If you do not want to make a parametric assumption on the distribution of the population, there are many distribution-free tests in the NPAR1WAY procedure. The runs test is not included in PROC NPAR1WAY because there are other tests that have greater statistical power. (In fact, Jame Bradley's Distribution-Free Statistical Tests (1968, p. 263) says "This is one of the least powerful distribution-free tests.")
Nevertheless, let's see how you can use the runs test to test for identical populations. The Sashelp.bweight data set contains the birth weight of 50,000 babies. The following DATA step extracts the first 50 observations from the data: 31 boys and 19 girls. You might want to know whether the distribution of birth weight for boys is the same as the distribution of weight for the girls.
data bweight; /* choose 50 obs subset of the data */ set sashelp.bweight(keep=Weight Boy); N = _N_; if _N_<=50; run; proc sgplot data=bweight; title "Birth weight of 50 Babies"; scatter x=N y=Weight / group=Boy markerattrs=(symbol=CircleFilled); keylegend / position=bottomright location=inside across=1 title="Boy"; xaxistable boy / location=inside; /* SAS 9.4 feature */ run; |
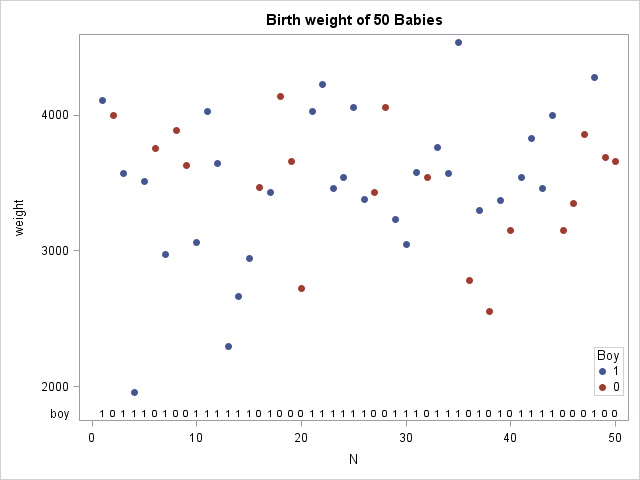
The data are shown in the scatter plot, which also demonstrates a cool new feature of SAS 9.4. The XAXISTABLE statement is used to display a small table at the bottom of the graph that indicates whether each observation is a boy (1) or girl (0)! (Click to enlarge.)
If the two samples (weights of boys and girls) come from the same population, the boys and girls should be randomly distributed in a sequence of the ordered weights. However, if girls tend to weigh less than boys, you would expect to see more girls at the beginning of the sequence and more boys at the end. You can use the runs test to determine whether the sequence is random.
The following SAS/IML program reads the weight and gender of the babies. The program sorts the data by weight and uses the runs test to analyze the resulting sequence of genders. The RunsTest module needs to be defined or loaded before it is called.
proc iml;
load module=RunsTest;  /* load or define the RunsTest module */

/* Application 1: Determine whether two samples are from the same population.
   Sort the data. Form two-value sequence that indicates the sample to which
   it belongs. If populations are identical, the sequence is random. */
use bweight; read all var {"Weight" "Boy"} into X; close bweight;

call sort(X, 1);          /* sort data by weight */
seq = X[,2];              /* two-value sequence to test */
test = RunsTest(seq);
print test[c={"Runs Statistic" "p-value"} L="Runs Test (Two Populations)"]; |
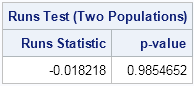
The RunsTest module returns a large p-value, which indicates that the sequence appears to be random. Notice that this is a distribution-free test because it uses only the fact that the data are from two groups. The test does not assume any special shape for the distribution of the population.
Is a sequence randomly distributed about some central value?
Consider the problem of filling a box with cereal as it rolls down an assembly line. If the filling process is in control, the amount of cereal in each box is the target value (such as 450 grams) plus or minus some small random amount. If you weigh a sequence of cereal boxes, you can divide the units into two categories: those that weigh more than the target value and those that weigh less. If the variation is random, the sequence of "More" and "Less" should be random.
By subtracting the target value from each box's weight, the sequence is transformed into a sequence of positive and negative values. The following SAS/IML statements model the assembly line by simulating a sequence of 30 random values from a standard normal distribution. Positive values are assigned the value +1 and negative values are assigned the value –1. The new sequence of values {+1, –1, –1,..., +1} is sent to the RunsTest module:
/* Application 2: Is P(X<=0) constant during data generation? */
call randseed(123);
x = j(30,1);               /* 30 x 1 vector */
call randgen(x, "Normal"); /* fill with random normal values */
s = sign(x);               /* s=1 iff x>0 */
Test = RunsTest(s);
print Test[c={"Runs Statistic" "p-value"}
L="Runs Test (Normal Sequence)"]; |
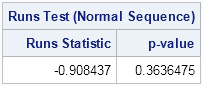
The runs test returns a large p-value, which indicates that there is no reason to doubt that the sequence is random. Although this does not prove that the RANDGEN function generates random values, it does indicate that there is no pattern to the positive and negative values.
Although the runs test is not very powerful, the test is simple and easy to understand, and rather fun to think about and implement. It is also a good example for showing how you can use the SAS/IML language to extend the statistical capabilities of SAS software.
