The generalized birthday problem

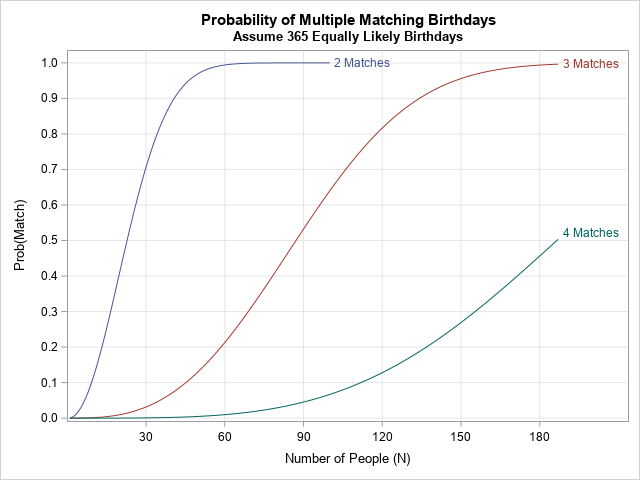
The birthday-matching problem (also called the birthday paradox or simply the birthday problem), is a classic problem in probability. Simply stated, the birthday-matching problem asks, "If there are N people in a room, what is the chance that two of them have the same birthday?" The problem is sometimes called