Sharing pearls of wisdom: SAS kicks off Women’s Executive Engagement series

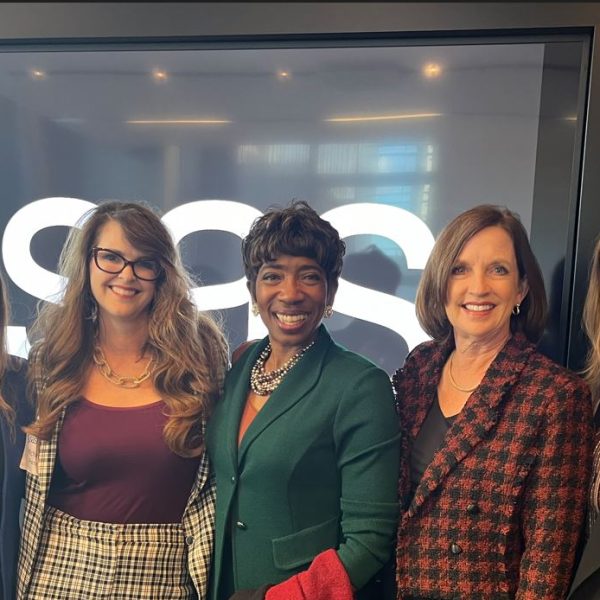
Inspiring discussions with Carla Harris and fellow executives in the heart of NYC. In October, leaders from SAS and other organizations in life sciences, health care, and health care-focused finance participated in a transformative leadership event. This experience left a lasting impression. The event was the kickoff of SAS’ first