If you're into 1980s pop music, then I bet you love Billy Joel's song We Didn't Start the Fire. But do you know every word, and the significance of every reference? Let's use SAS software to create an interactive visualization that will help you fully understand this song! I first saw
Author
Since this is an election year, I've been scrutinizing the voter registration data. One thing that surprised me is there are more female voters registered in NC than males. I wondered if this was consistent across all 100 counties, and created some charts to help visualize the data... First I went
There's an old expression "if you can't measure it, you can't manage it" - and while that expression probably isn't universally true (as pointed out in this interesting article), I think having a way to quantify your stress could be useful. I recently read an interesting article about the Holmes-Rahe Life
Where is solar and wind power generated in the US? Let's visualize this data on a map... I recently saw the following map on the metricmaps.org website. It caught my attention because it looks like North Carolina has a lot of solar power plants, whereas our neighboring states have very few.
I ran across a map recently that seemed to show a lot of US states are primarily coal-powered. The map was a little difficult to read, so I decided to give it a SAS makeover ... Before we get started, here's a picture my friend David took of the Shearon Harris Nuclear Power
How is it that 91% of the US didn't vote for either Hillary or Trump in the primary, but yet they're still the final two candidates in the presidential election? Let's break it down with a simple graph! I recently saw a really cool slideshow on the nytimes website, that answered
I usually try to avoid political or religious debates ... but as an impartial data analyst, it is possible to analyze data about something, without entering into the debate. In this blog post, I try to walk that fine line, and analyze data about the political leanings of religious groups in the US.
Were you the kid who sat there analyzing the amusement park map before entering the park, planning out how you could visit the most rides in the least amount of time? If so, then this blog's for you, my data analyst kindred spirit! And to get you in the mood,
The way your graph looks can make all the difference ... two people can graph the exact same data in essentially the same way, but one of the two graphs can be perceived as much better than the other. Hopefully reading my blogs will help you create the better graph!
One of my favorite quotes is: "You can't believe everything you read on the Internet" - Abe Lincoln, 1868. And that is especially true when it comes to graphs and statistics. Hardly a day goes by without me seeing a bad graph that misrepresents the data (either intentionally or unintentionally) .
With the Pokémon Go craze sweeping the world, techies and programmers are looking to apply their skills to gain an advantage over the average user. In this blog post, I show how to use some of SAS' geospatial analytics capabilities to capture a Pikachu. Let's say you know of a building that has
What would it be like if the US was in the EU? I don't know how that would work out politically, but this map shows how it might look geographically (if the US was literally picked up and moved to Europe!) My buddy Rick Langston is a bit of a
So, how many different Pokémon have you caught - and more importantly, how many different kinds are still out there that you haven't caught yet? I've created some graphs that might help you figure it out! I think my previous blog post might have irritated some of the hardcore Pokémon players out there
Are you caught up in the recent Pokémon Go craze? Or maybe just trying to figure out what all the fuss is about? In this blog post, I try to analyze all the important Pokémon-related data in one graph! When the original Pokémon game first came out around 1995, you needed
What information should you make easily available from the top page of your website? This Venn diagram might help you decide! Have you ever gone to a website to try to find some information, and had a (expletive) difficult time trying to find that info? I think there is often a
I've noticed fewer and fewer people smoking these days, and was wondering who the last holdouts are. Let's run some numbers and find out... Back in the 1950s, 60s, and 70s it seems like almost everyone smoked. You hardly ever saw the "cool kids" such as James Dean without a cigarette -
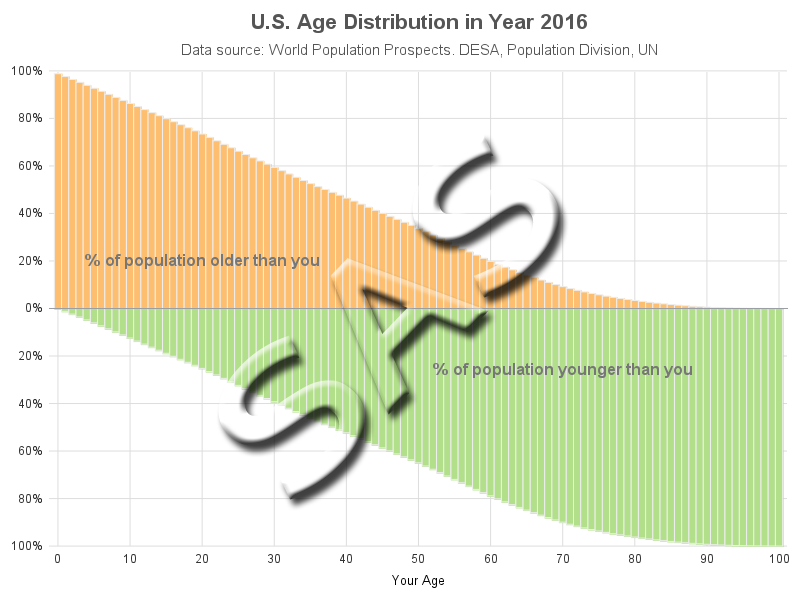
They say age is a relative thing. With this graph, you can tell how old (or young) you are, relative to everyone else. (I'll let you decide whether this is a good thing, or a bad thing, hahaha!) Nathan Yau recently posted a graph on flowingdata.com that allows you to
With the recent vote for the United Kingdom to leave the European Union being all over the news, I was a bit embarrassed to realize I didn't know exactly what areas are (and aren't) considered part of the UK. After a few Google searches, I found the following map on the
Let's create a souped-up SAS map that can track Zika-carrying mosquitoes down to the county level, in the US! A few months ago, I wrote a blog post with a world map of documented locations of the Aedes mosquitoes that could carry the Zika virus. The world map showed a high concentration
In recent years, more and more people have been registering as independent voters in the US, rather than Democrat or Republican - the independents now control well over 1/3 of the votes. Will they likely vote for the Democrat or Republican candidates in the upcoming election? Let's break down some numbers
Here in the US, our July 4th Independence Day holiday is coming up. It's a festive holiday with lots of fun & fireworks, but you also need to also be careful ... and I've got the graphs to prove it! Last year, I wrote a blog post about a SAS
I recently read an article that claims 35% of men, and 40% of women in the US are now obese. Yikes! I wondered when this happened, and whether it had been a gradual or sudden change. If I only had some graphs ... which the article didn't provide. I did some
With recent advances in quadcopters, or drones, they have become pretty capable and fun flying machines. And just about anybody can afford the entry-level models. They've recently become prevalent enough that the government has started coming up with rules, and the Federal Aviation Administration (FAA) started requiring owners to register drones that
For the first time in 4.5 years, we had a day with zero sunspots - I think this special occasion calls for some sunspot graphs! But before we get started, here's one of the many pictures my friend Kirk took of the sun down in Marco Island, Florida. Spots or no
When using visual analytics, it's important to realize that WYSIWYG (what you see is what you get) is not always true. By recognizing a few optical illusions and tricks, you might become a better data analyst ... and have some fun along the way. Let's start with the Koffka Rings
Teacher salaries have been a hotly debated issue in our state for the past few years. In this blog post, I examine a graph that recently appeared in our local news, point out some deficiencies, and create an alternate graph. But before we get started, here's a picture of my
The US has almost 400 national parks, and has been keeping attendance data for about 100 years. With a holiday weekend coming up, I thought this would be a good time to crunch those numbers, and see how each park compares to all the others... I first saw the tip of
Do you need help picking a summer vacation destination - one that's not just great, but surreal? If so, this blog's for you! It's that time of the year again - I've got gobs of vacation time saved up, but I was drawing a blank on where to go... So I turned
How bad was the recent recession on the Las Vegas housing market, and what lingering side effects are still being felt? If you don't know squat about real estate housing markets, then this blog post is for you! It takes a simple graphical look at some data that helps explain
In this blog post I explore some of the open data police incident reports for Raleigh and Cary, while showing you the easy way to handle various types of CSV files. In recent years, many cities have set up open data websites, to share various kinds of data about their city.