There's an old expression "if you can't measure it, you can't manage it" - and while that expression probably isn't universally true (as pointed out in this interesting article), I think having a way to quantify your stress could be useful.
I recently read an interesting article about the Holmes-Rahe Life Stress Inventory, which assigns numeric values to various sources of stress. You sum up your score for the stress you've experienced in the past year, and you can then determine the likelihood of having a major health breakdown based on that score.
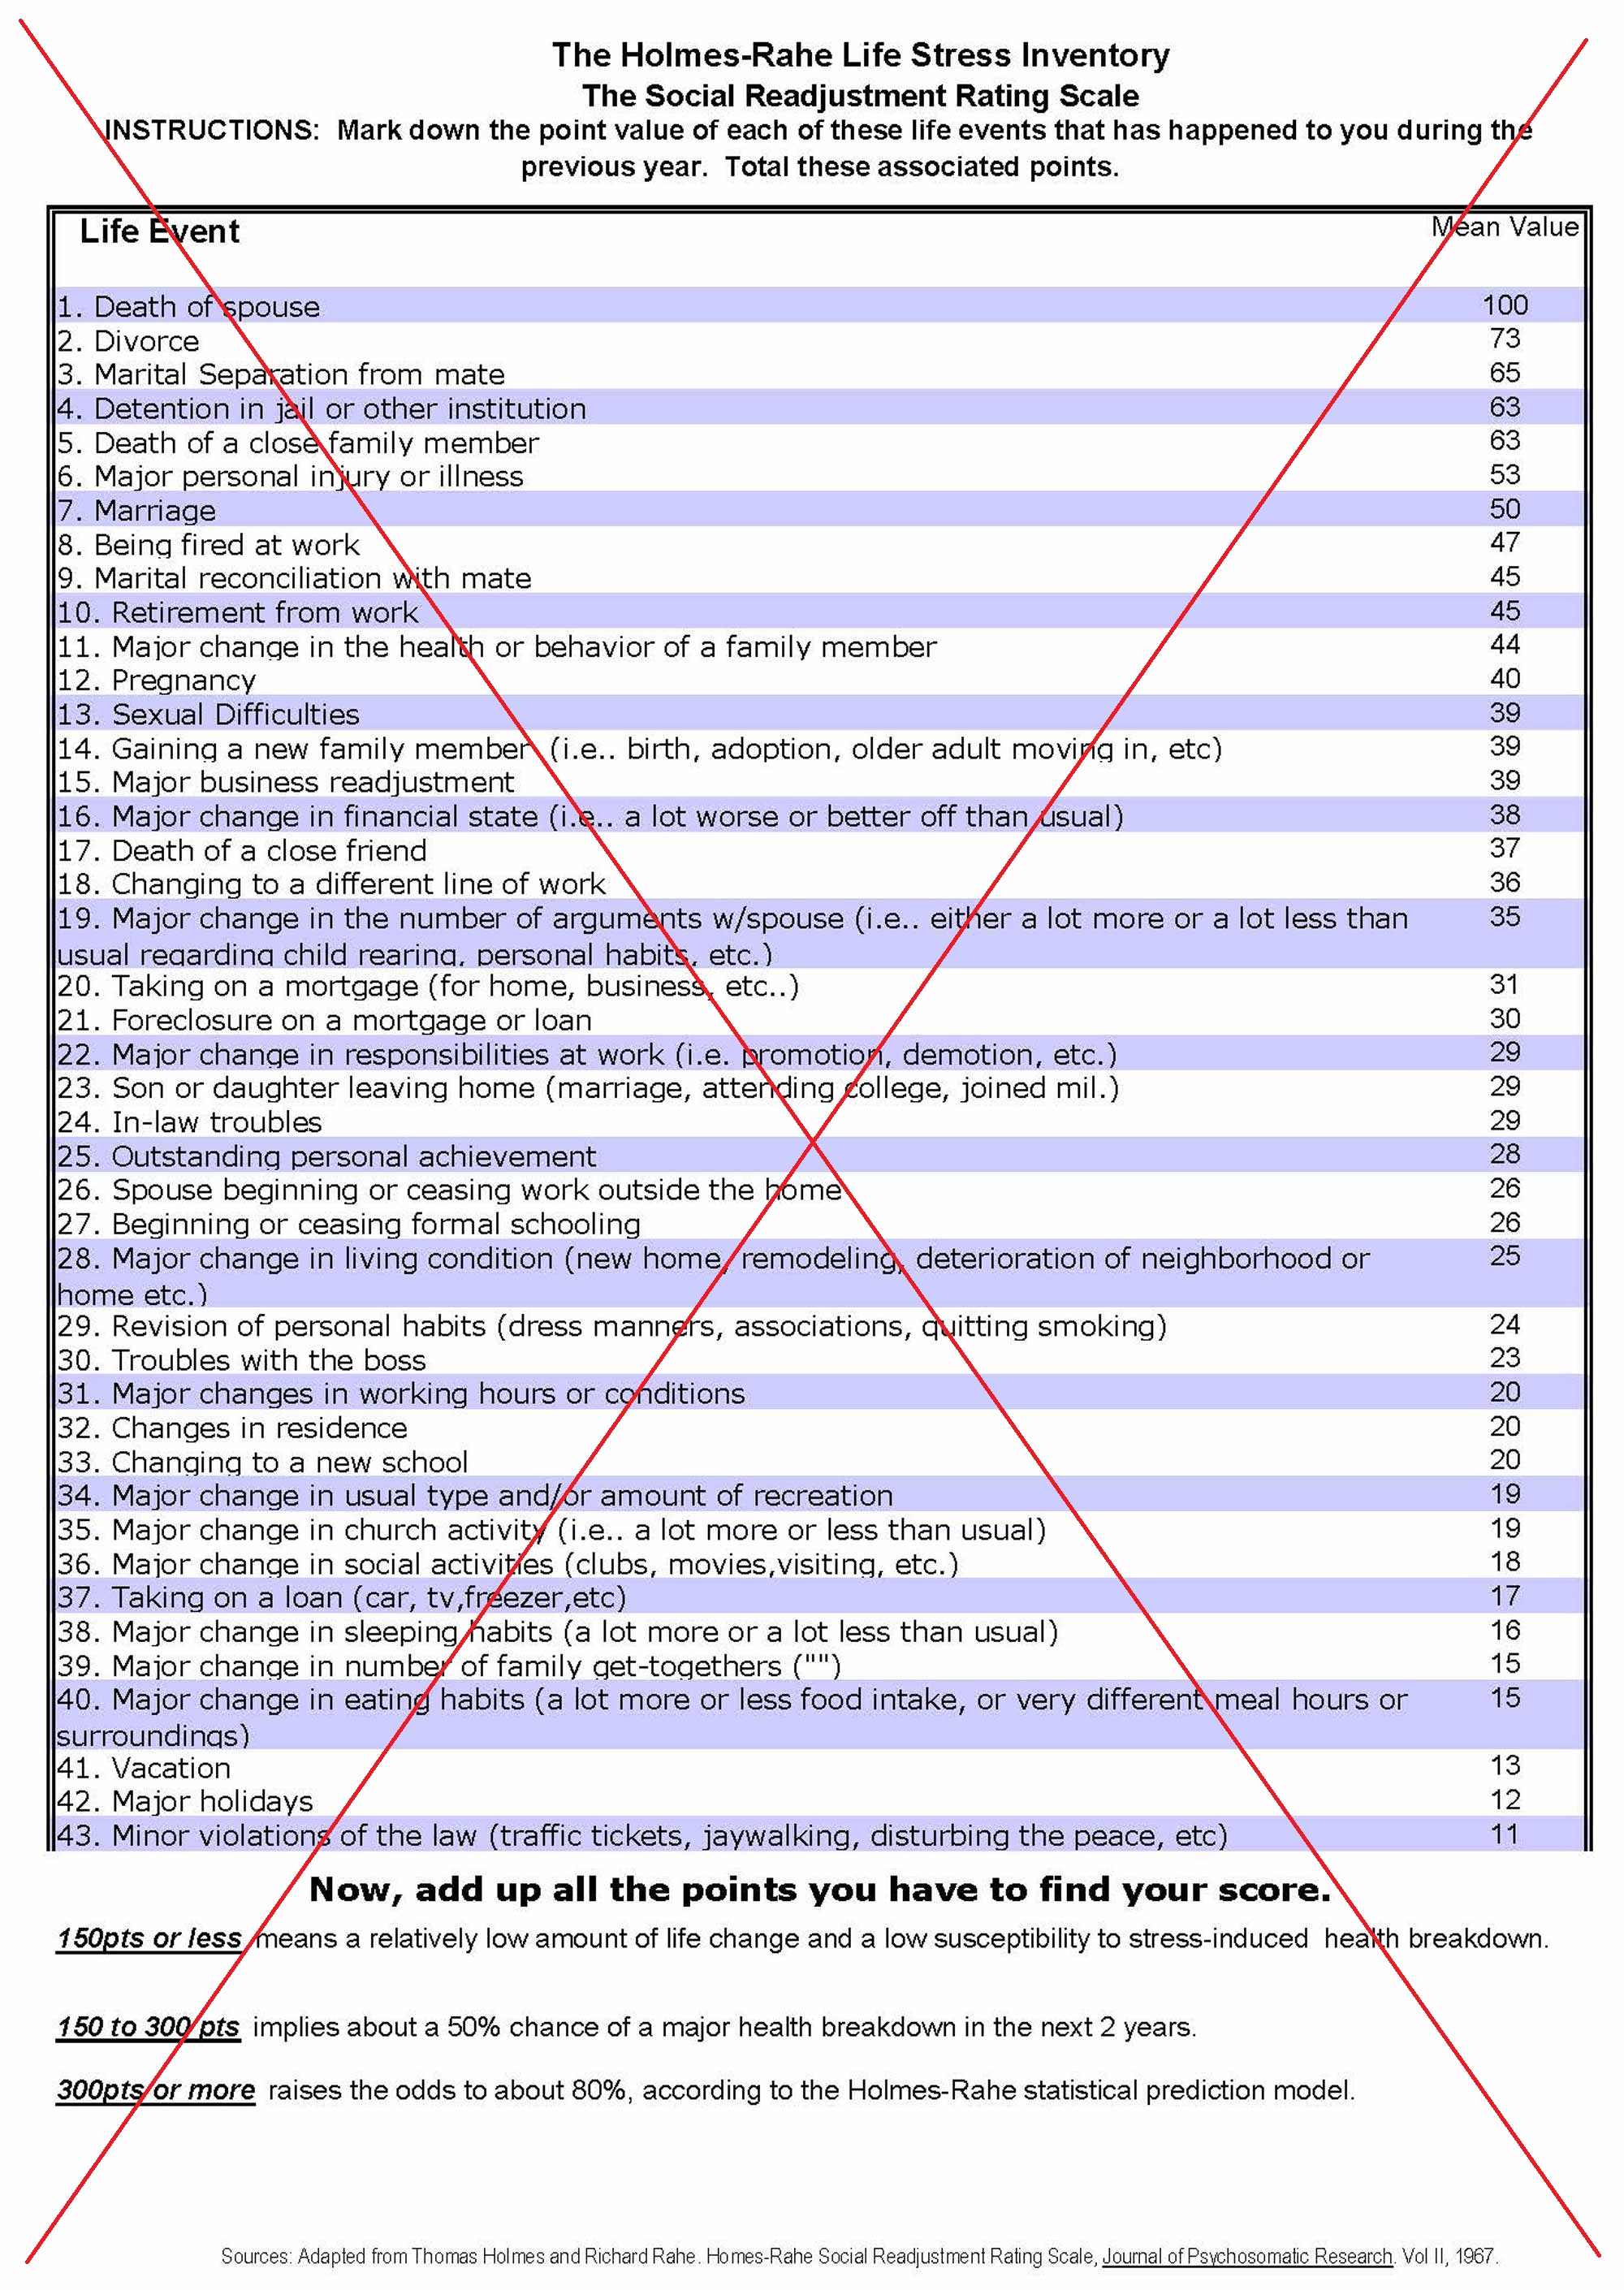
The information in their table was interesting, but I thought it was a bit awkward to work with. The numeric values of the stress events were on the far right, so your eye had to follow all the way across the page to find them. They also numbered each item along the left (I'm not sure why), and these numbers could be confused with the score values. And showing the numeric ranges as text at the bottom of the table just didn't seem intuitive.
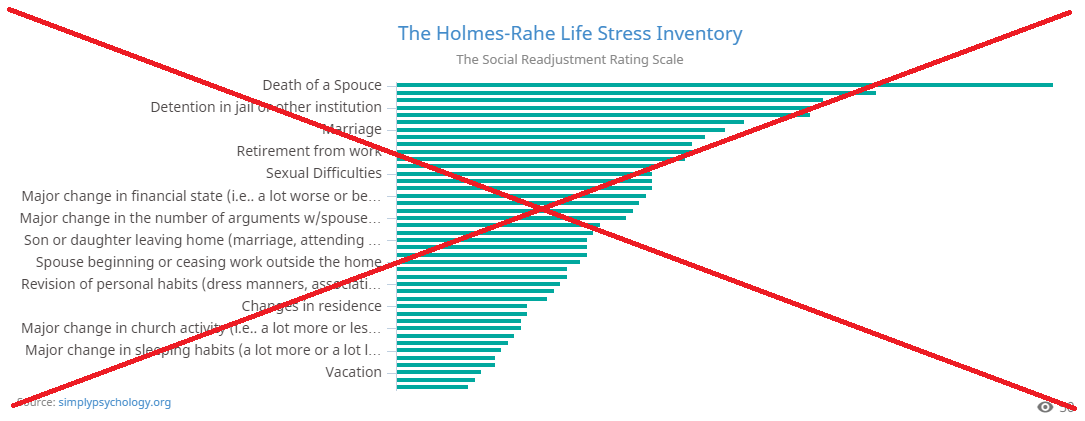
I looked around a bit, and found a graphical version on statpedia. I had high hopes, but it had even more problems than the original text table. The bars were too tightly packed to show all the text labels, so they just arbitrarily 'thinned out' many of the labels (who does that with this kind of data?!?) And for the longer text, they just arbitrarily truncated those labels, replacing the text with '...'. Their graph didn't tell you to total up your score, and it didn't show you what the ranges were for the total values once you got them.
Here's what I did to (hopefully) fix all the problems ...
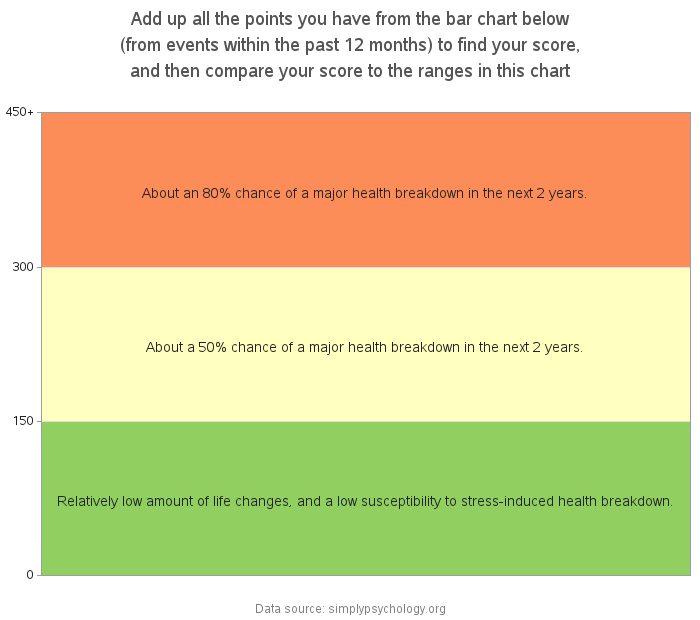
I created a chart representing the numeric ranges of the results as colored bands - I think this is much more intuitive than just describing the ranges in text. I show this chart first (before the list of stress sources), to give the user an idea of what the stress values (in the bar chart) will be used for.
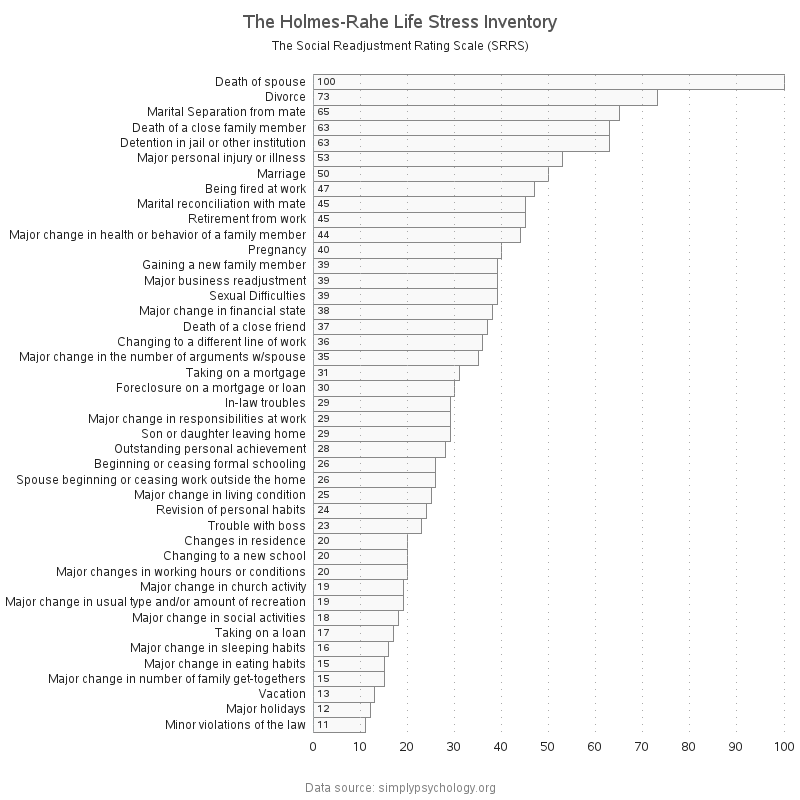
Here's my bar chart. Note that I show every bar label - no thinning of labels in my bar charts! And rather than arbitrarily truncating long text, I shortened the text by removing the ( )'d explanatory portion, and then I show that extra info as mouseover-text. Also, rather than showing the numeric values on the right side of the page, I show them on the left side of each bar (so your eye can find the values much more quickly and easily). Click the bar chart image below, to see the full-size interactive version with the mouseover-text.
So, what was your stress score, and what's your advice for dealing with stress? My friend Trena has a fairly high score right now, and she uses this stress ball to help deal with it:


1 Comment
I like this. I wish you could click on the bars and calculate your score... Have a stacked bar alongside or something. Very cool.