The Number-Word Game

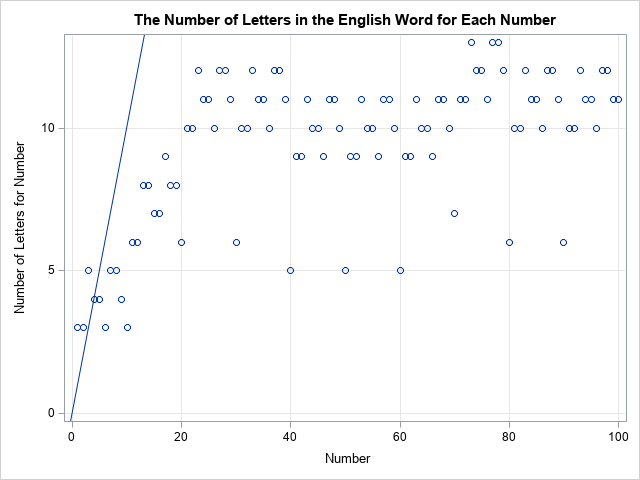
Have you heard about the Number-Word Game? This is a simple game that has the following rules: Start with any positive integer. Write down the English word for the integer. Count the number of letters in the word. This gives a new positive integer. Go to (2). Repeat until a